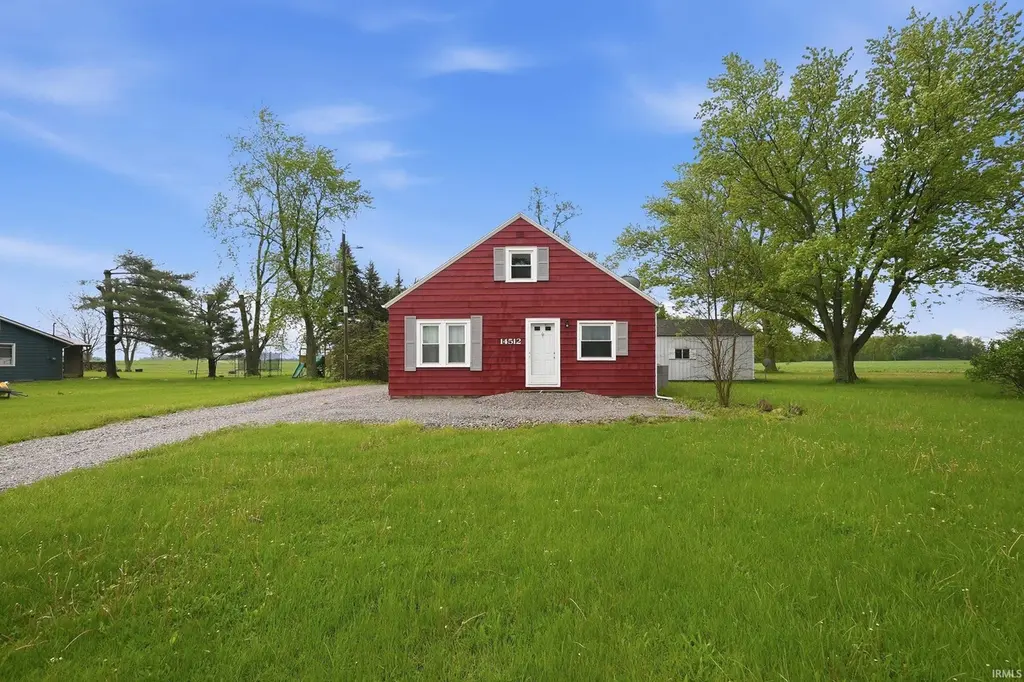
14512 Dawkins Rd · New Haven, IN
Flood risk 1/10 · Minimal
- FEMA flood zone
- X (unshaded)
- Chance of flooding over 30 yrs
- 0.0%
- Est. flood insurance / yr
- $507 – $1,088
Fire risk 1/10 · Minimal
- Est. fire insurance / yr
- $717 – $1,331
Heat risk 3/10 · Minor
- Hot days now (above 100°F)
- 7 days/yr
- Hot days in 30 yrs
- 17 days/yr
Wind risk 2/10 · Minimal
- Chance of severe wind over 30 yrs
- —
Air-quality risk 3/10 · Minor
- Unhealthy air days now
- 3 days/yr
- Unhealthy air days in 30 yrs
- 3 days/yr
Risk factors via First Street. Map © Google.
Why this score? — see what drove the D+ grade
The composite is a weighted blend of 9 inputs, each scored 0–100. Each bar is that input's sub-score; the figure is the points it added to the 100-point composite (weight × sub-score).
- ARV discount +15.0/15.0
- Cash flow +12.6/30.0
- DSCR +3.8/10.0
- Schools +3.6/10.0
- Livability +3.5/5.0
- 1% rule +2.5/10.0
- Rent growth +2.5/5.0
- Condition / age +2.5/5.0
- Appreciation +0.0/10.0
$220,000
🖨 Deal sheet (PDF) 📄 Offer letter ✓ Due diligence
Listing remarks MLS
Situated on almost an acre, with beautiful views of expansive fields and bright blue sky's, this home is the perfect combination of rural living with a close proximity to city amenities. Recently updated with a bathroom remodel, new flooring, trim and paint throughout. Two amble bedrooms downstairs and a large bedroom upstairs is a wonderful use of a compact space. Outside you'll love the large yard with mature trees, firepit and 24x32 pole barn! Don't miss out on this lovely home!
Key facts
- Large out building
- Mature trees
- 0.9 acre lot
Tags
Property features AI
Exterior
- Parking: Detached garage; Garage door opener; Gravel parking; 2 garage spaces
- Utilities: Private well water; Septic tank sewer
- Home design: Single-family residence (site-built); One story
- Construction: Aluminum siding; Asphalt roof; Built as a site-built home
- Exterior features: Sloped lot; No fencing
Interior
- Kitchen: Refrigerator; Electric range
- Bedrooms: Total rooms: 6
- Flooring: Carpet; Vinyl
- Bathrooms: 1 full bathroom (main level)
- Heating & cooling: Forced air heating; Central air conditioning
- Interior features: Laminate countertops; One fireplace
- Laundry & utility: Washer hookup (main level); Electric dryer hookup (main level)
Neighborhood map
What this means for you Summary
Snapshot
- This is a 3-bed/1.0-bath single-family listed at $220k.
Deal economics
- At list price, monthly cash flow is $-27 ($-329/yr) — negative.
- To cash-flow at today's rent, offer at most $215k (2.2% below list).
- To meet the 1% rule (rent ≥ 1% of price), the offer needs to be $164k (25.4% below list).
- Recommended offer: $164k (25.4% below list) — sets the bar for 1% rule.
- Cap rate 6.1% vs local median 4.8% in New Haven — meaningfully above typical; check what's discounted (condition, days-on-market, listing class) to confirm the premium yield is real.
Location & tenants
- Location reads 70/100 on livability (#149 in IN) — a middle-class / working-renter tenant base. Strengths: cost of living A+, housing A+, crime B+; Watch: employment D, amenities F, commute F.
- East Allen County Schools (suburban): math 36% / reading 47% proficiency, ranked #122 of 301 in IN (top 40%) — families likely to look elsewhere, expect single-tenant / working-renter base with shorter leases.
- Zoned schools: Heritage Elementary School (math 36% / reading 40%, grade F, #538 of 994 statewide, top 54%, 508 students, 61% FRL); Woodlan Jr/Sr High School (math 35% / reading 52%, grade F, #191 of 369 statewide, top 52%, 727 students, 31% FRL) — zoned schools at 46% FRL track the district average.
- Market conditions: 180 active listings in the ZIP; 1,861 units permitted in Allen County in 2024 (576 in 5+ unit buildings).
Forward outlook
- Local home prices are declining (-3.0%/yr); year-one equity from $2k of loan paydown is wiped out by about $7k of value loss. Plan a longer hold.
- Allen County population projected at +10% by 2050 — modest demand growth; plan on rents tracking national, not racing it.
Negotiation context
- Only 10 days on market — expect competitive offers; lowballing is unlikely to land.
- 2 sale attempts since 4y ago with the ask held roughly flat each time — persistent listings suggest the price (not the market) is what's stuck; bring a comps-based counter.
- Current owner paid $180k; 23% above their basis — modest negotiation headroom, anchor on the comps not their cost.
Risks & watch-outs
- Watch-outs: built in 1900 — expect roof / HVAC / electrical / plumbing capex.
Questions for the listing agent
- What do current leases actually rent for vs. the listed asking? Can we see a recent rent roll and the last 12 months of T-12 income?
- Built in 1900 — when were the roof, HVAC, electrical panel, plumbing, and water heater last replaced?
- Is there a deadline driving the sale (1031 exchange, divorce, estate, relocation)? That informs how much negotiation room exists.
- Schools are D-rated, which usually means shorter tenancies and higher turnover. Who's the typical renter profile here, and what's been the actual vacancy rate?
- The area grade is low — what's the realistic commute time and amenity access for the typical tenant pool here? Any planned neighborhood developments (good or bad) we should know about?
- What's the average days-on-market for RENTAL listings here right now (not sales)? A rising rental-DOM trend means longer vacancies and softer asking-rent achievability than the comps imply.
- What's the recent tenant-quality profile in this submarket — average credit score on applications, eviction rate, late-payment / NSF rate, and stable-employment percentage? A property-management company in the area should have these aggregated.
- How much new for-sale + rental construction is in the pipeline within 1–3 miles? Heavy new supply typically softens prices + rents 12–24 months out; constrained supply supports both.
Investment metrics
- 1% rule
- 0.75% ✗
- Cap rate
- 6.14%
- Cash-on-cash
- -0.53%
- DSCR
- 0.98
- GRM
- 11.2
CMA / ARV
- ARV (median comp)
- $315,731
- List price
- $220,000
- Delta
- -30.32%
- Verdict
- UNDERPRICED
- Comps
- 3 within 2.0 mi
Projected returns pro-forma
-3.0% appreciation · 3.0% rent growth · sell at horizon
- IRR
- -17.2%
- Equity multiple
- 0.39×
- Total profit
- $-37,489
- Equity at exit
- $32,803
- IRR
- -9.3%
- Equity multiple
- 0.43×
- Total profit
- $-35,278
- Equity at exit
- $19,022
Cash invested: $61,600 (down + closing). Projections, not guarantees.
Landlord ↔ Tenant lean methodology
- Overall (STATE)
- 90 Strongly Landlord-Friendly
- State Indiana
- 90 Strongly Landlord-Friendly · R+11
- County
- — inherits STATE
- City
- — inherits STATE
ZIP-level market 46774
- Active inventory
- 180
- Price-to-rent
- 11.2×
Monthly cashflow live
- Estimated rent
- $1,642 medium interval (Pro) →
- Mortgage (P&I)
- −$1,154
- Tax from tax record
- −$79 /mo · $949/yr
- Insurance
- −$92
- HOA
- −$0
- Vacancy / Maint / Mgmt
- −$345
- Net cashflow
- $-27
Break-even live
Sensitivity live
| Price | -10% $97 | -5% $35 | +0% $-27 | +5% $-90 | +10% $-152 |
|---|---|---|---|---|---|
| Rent | -10% $-157 | -5% $-92 | +0% $-27 | +5% $37 | +10% $102 |
| Rate | -1.0pp $83 | -0.5pp $29 | base $-27 | +0.5pp $-84 | +1.0pp $-142 |
UW: 25.0% down · 7.5% · 30yr · 1.5% tax · 5.0% vac · 8.0% maint · 8.0% mgmt
Financing live
Cash to close
- Down payment
- $55,000
- Closing costs
- $6,600
- Reserves months
- —
- Total cash needed
- —
Loan-product check · same deal, 3 products live
Conventional
25% down · 7.5% · 30yr
- Down + closing
- —
- Monthly P&I
- —
- Monthly cashflow
- —
- DSCR
- —
- Eligible?
- —
Personal DTI + credit; lowest rate.
DSCR
20% down · 8.5% · 30yr
- Down + closing
- —
- Monthly P&I
- —
- Monthly cashflow
- —
- DSCR
- —
- Eligible?
- —
No personal income docs; deal must DSCR.
Hard money
10% down · 12.0% · 12mo
- Down + closing
- —
- Monthly P&I
- —
- Monthly cashflow
- —
- DSCR
- —
- Eligible?
- —
Short-term bridge; refi at stabilization.
Listing history 4 events
-
2026-05-14status Pending 599-char remark
-
2026-05-04$220,000 Active 599-char remark
-
2022-02-25soldstatus $179,500 486-char remark
Show marketing remark (486 chars)
Situated on almost an acre, with beautiful views of expansive fields and bright blue sky's, this home is the perfect combination of rural living with a close proximity to city amenities. Recently updated with a bathroom remodel, new flooring, trim and paint throughout. Two amble bedrooms downstairs and a large bedroom upstairs is a wonderful use of a compact space. Outside you'll love the large yard with mature trees, firepit and 24x32 pole barn! Don't miss out on this lovely home!
-
2022-01-15$179,500 486-char remark
Show marketing remark (486 chars)
Situated on almost an acre, with beautiful views of expansive fields and bright blue sky's, this home is the perfect combination of rural living with a close proximity to city amenities. Recently updated with a bathroom remodel, new flooring, trim and paint throughout. Two amble bedrooms downstairs and a large bedroom upstairs is a wonderful use of a compact space. Outside you'll love the large yard with mature trees, firepit and 24x32 pole barn! Don't miss out on this lovely home!
ⓘ Source: listings_history table (triggers on properties + properties_extension) + one-shot
backfill from property_details.listing_events for pre-trigger history.
Tax reassessment forecast IN · Partial reset (capped growth)
- Current annual tax
- $949 · $79/mo
- Projected year-2 tax
- $1,410 · $117/mo
- Expected delta
- +$460/yr (+$38/mo · 48.5%)
ⓘ Screening estimate from a state-policy table — verify with the county assessor before closing.
Climate risk First Street
- Flood 1/10 Low FEMA zone X (unshaded) · 0% chance over 30 yrs
- Wildfire 1/10 Low
- Heat 3/10 Moderate 7 d/yr ≥100°F today · 17 d/yr by 30 yrs out
- Wind 2/10 Low
- Air quality 3/10 Moderate 3 unhealthy d/yr today · 3 by 30 yrs out
Nearby sold comps map
Loading sold comps map…
Walkable amenities ~0.75 mi
Loading nearby amenities…
Taxation est. · year 1
- Rental income
- $19,703
- − Mortgage interest
- −$12,323
- − Property taxes
- −$949
- − Insurance
- −$1,100
- − Repairs & maintenance
- −$1,576
- − Management
- −$1,576
- − Depreciation
- −$6,400
- Taxable loss
- −$4,222
- Est. tax savings @ 24.0%
- +$1,013
- After-tax cash flow
- $685/yr
For passive investors: Depreciation is non-cash, so a rental often shows a tax loss while cash-flowing — sheltering income. Rental losses are passive: they offset passive income freely, and up to $25,000/yr can offset ordinary (W-2) income if you actively participate and your MAGI is under $100k (phasing out to $0 by $150k); unused losses carry forward. On sale, claimed depreciation is recaptured at up to 25%, and gains may owe capital-gains tax (a 1031 exchange can defer both). Figures are a year-1 estimate at your 24.0% rate — not tax advice; consult a CPA.
Schools (NCES district)
- District
- East Allen County Schools
- NCES district ID
- 1802850
- Math proficiency
- 36% ▼ -8.00%
- Reading proficiency
- 47% ▼ -4.00%
- Median HH income
- $50,524
- Composite
- 35.75/100
- National rank
- #4849
- State rank
- #122 of 301 in IN
Livability — New Haven
- Score
- 70/100
- State rank
- #149
- US rank
- #7499
Category grades
Schools grade is shown separately in the Schools card above.
Census & demographics
- Population (ZIP)
- 17,066
Population outlook (Allen County) Hauer SSP2
- Today (2025)
- 394,020 people
- By 2030
- 405,128 · +2.8%
- By 2040
- 423,476 · +7.5%
- By 2050
- 435,137 · +10.4%
- By 2075
- 450,293 · +14.3%
- By 2100
- 424,101 · +7.6%
Race, ethnicity, and origin ACS 2023
- Neighborhood character
- Predominantly White (89%)
- Race & ethnicity
- White 89% Two or more races 4% Hispanic / Latino 4% Black 3% Asian 1%
- Common ancestry
- Lithuanian 5% Italian 2% Slovak 1%
- Foreign-born
- 3% · Canada, Philippines
- Languages at home
- 89% English-only · German/W. Germanic 6% Spanish 3% Chinese 1%
Political lean MEDSL · Allen
- 2024 margin
- R (+12.5) · D 42.9% · R 55.4% · Other 1.7%
- 2008→2024 swing
- -8.1pp toward R · 2008: -4.3pp · 2024: -12.5pp
- All cycles
- 2024: R+12.5 2020: R+11.2 2016: R+19.6 2012: R+16.8 2008: R+4.3
Not yet ingested
- Civics
- —
Market trends
- HPI YoY
- ▼ -185.27%
- Current HPI
- 241.5333
- Rent YoY
- —
- Metro
- —
- State GDP YoY
- ▲ 2.90%
- F500 in state
- 18
Industry mix (Fortune 500 HQ in IN)
| Industry | F500 HQs | Revenue |
|---|---|---|
| Industrial Machinery | 2 | $37B |
|
||
| Healthcare | 1 | $177B |
|
||
| Pharmaceuticals | 1 | $45B |
|
||
| Metals / Steel | 1 | $18B |
|
||
| Agriculture | 1 | $17B |
|
||
| Packaging | 1 | $12B |
|
||
Price history
+22.6% since first listed4 events — show timeline
- 2026-05-14 Pending — IRMLS
- 2026-05-04 Listed $220,000 IRMLS
- 2022-02-25 Sold (MLS) $179,500 IRMLS
- 2022-01-15 Listed $179,500 IRMLS
Property tax history
+8.3%/yrLatest (2024): $949 · +11.4% YoY. Source: county tax records.
Cash-flow waterfall
monthlySold comps — $/sqft
last 12 mo · ≤1 miLoading sold comps…