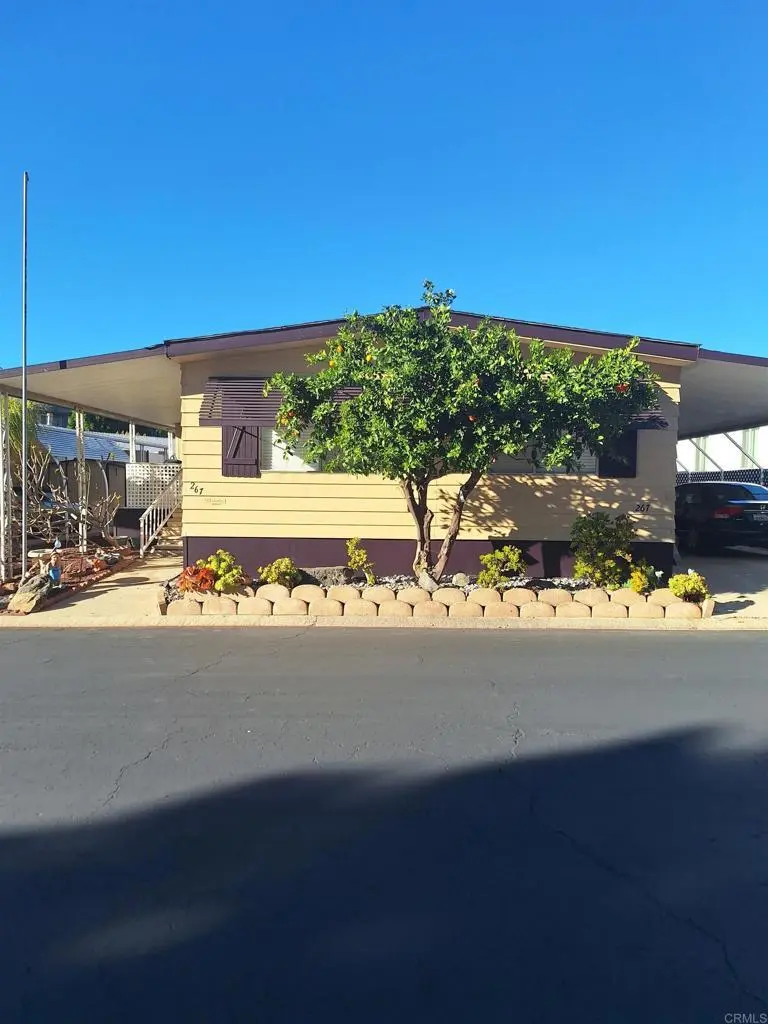
1401 El Norte Pkwy #267
San Marcos, CA 92069
$415,000D
2 bd · 2.0 ba ·
1,440 sqft ·
Built 1972
· Manufactured
· Active
· 102 DOM
Cashflow @ list (25.0% down · 7.5%)
Estimated rent
$3,201/mo
Mortgage (P&I)
−$2,176
Tax + insurance
−$317
HOA
−$222
Vac / Maint / Mgmt
−$672
Net cashflow
$-187/mo
Annual
$-2,244/yr
Cap rate
5.75%
Cash-on-cash
-1.93%
DSCR
0.91
1% rule
0.77%
Cash to close
$116,200
Investor read
- This is a 2-bed/2.0-bath manufactured listed at $415k.
- At list price, monthly cash flow is $-187 ($-2k/yr) — negative.
- To cash-flow at today's rent, offer at most $382k (8.0% below list).
- To meet the 1% rule (rent ≥ 1% of price), the offer needs to be $320k (22.9% below list).
- It's been on market 102 days — a 9% lower offer ($378k) is reasonable based on typical stale-listing flexibility.
- Recommended offer: $320k (22.9% below list) — sets the bar for 1% rule.
- Local home prices are declining (-3.0%/yr); year-one equity from $3k of loan paydown is wiped out by about $12k of value loss. Plan a longer hold.
- Location reads 77/100 on livability (#80 in CA, #3,074 nationally) — a middle-class / working-renter tenant base. Strengths: amenities A+, commute A+, employment A+; Watch: health & safety D+, cost of living F.
- San Marcos Unified (suburban): math 52% / reading 67% proficiency, ranked #249 of 1,400 in CA (top 18%) — acceptable for families but not a draw, mixed tenant base, ~2y average lease.
- Market conditions: Rents flat; 115 active listings in the ZIP; 15 comparable units currently listed for rent nearby; rentals leasing fast (median 5d on market — plan ~1-2 weeks tenant-placement turnaround); solid renter incomes; 11,759 units permitted in San Diego County in 2024 (7,244 in 5+ unit buildings).
- San Diego County population projected at +20% by 2050 — long-run rental-demand tailwind backs the buy-and-hold thesis.
- 3 sale attempts since 18y ago; this cycle's ask is 4% above the opening price — seller raised mid-cycle; expect resistance to lowballs.
- Current owner paid $150k; list at $415k implies a 177% gain — meaningful room to come down on a strong offer.
- Climate carrying-cost: major wildfire risk; extreme-heat days projected 7→21/yr by 2055 (HVAC capex compounding) — expect insurance premiums to compound above CPI over the hold.
- Cap rate 5.8% vs local median 2.5% in San Marcos — top-decile yield for the area; either an underpriced asset or a hidden risk that comps aren't pricing in. Stress-test before assuming the spread holds.
- This rent runs 40% of the median local income ($97k/yr) — at the standard rent-burdened threshold; future hikes will face affordability resistance.
Questions for listing agent
- What do current leases actually rent for vs. the listed asking? Can we see a recent rent roll and the last 12 months of T-12 income?
- It's been on market 102 days. Have you received any prior offers? Is the seller open to a 23% concession, seller financing, or rate buy-down credit?
- Built in 1972 — when were the roof, HVAC, electrical panel, plumbing, and water heater last replaced?
- What does the HOA fee cover, when was the last increase, and are there any pending special assessments or reserve-fund shortfalls?
- Why hasn't it sold? Are there any deal-killer items the seller is aware of (foundation, flood, title, zoning, code violations)?
- Is there a deadline driving the sale (1031 exchange, divorce, estate, relocation)? That informs how much negotiation room exists.
- The area grade is low — what's the realistic commute time and amenity access for the typical tenant pool here? Any planned neighborhood developments (good or bad) we should know about?
- What's the average days-on-market for RENTAL listings here right now (not sales)? A rising rental-DOM trend means longer vacancies and softer asking-rent achievability than the comps imply.
CashFlowRE · CFR-SBG6SWD2MPX6G8
· Data 2 days ago
cashflowre.app · 2026-05-29