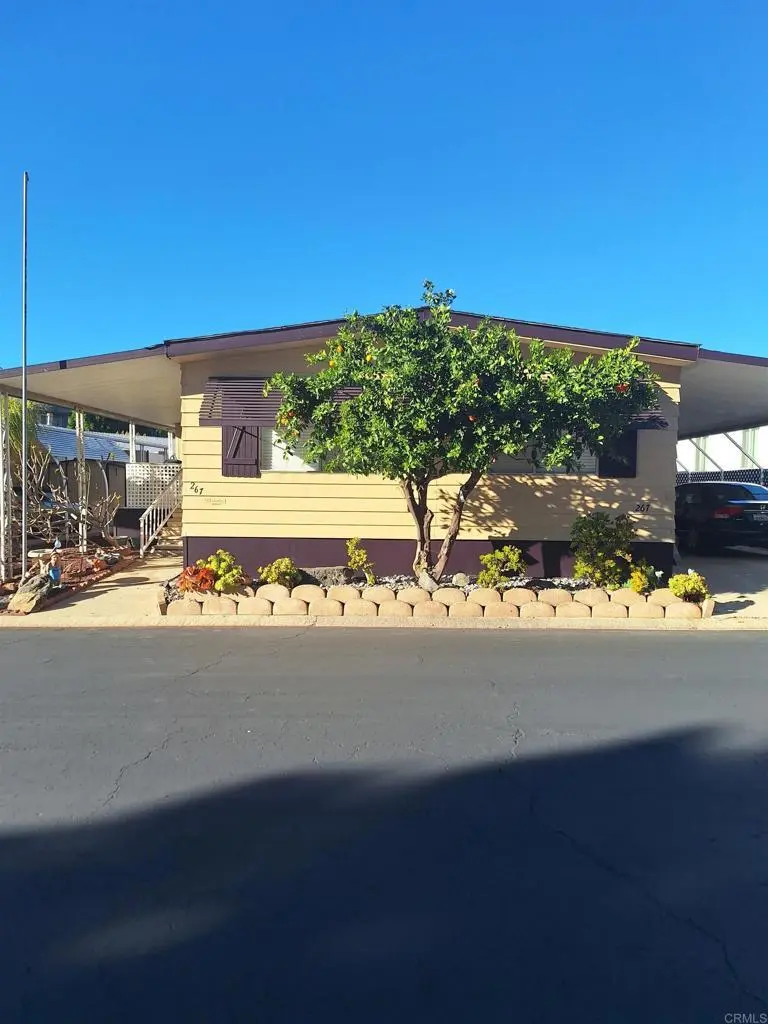
1401 El Norte Pkwy #267 · San Marcos, CA
Flood risk 4/10 · Minor
- FEMA flood zone
- X (unshaded)
- Chance of flooding over 30 yrs
- 0.22%
- Est. flood insurance / yr
- $507 – $1,088
Fire risk 6/10 · Moderate
- Est. fire insurance / yr
- $659 – $1,223
Heat risk 5/10 · Moderate
- Hot days now (above 97°F)
- 7 days/yr
- Hot days in 30 yrs
- 21 days/yr
Wind risk 1/10 · Minimal
- Chance of severe wind over 30 yrs
- —
Air-quality risk 3/10 · Minor
- Unhealthy air days now
- 4 days/yr
- Unhealthy air days in 30 yrs
- 4 days/yr
Risk factors via First Street. Map © Google.
Why this score? — see what drove the D grade
The composite is a weighted blend of 9 inputs, each scored 0–100. Each bar is that input's sub-score; the figure is the points it added to the 100-point composite (weight × sub-score).
- Cash flow +10.8/30.0
- ARV discount +10.2/15.0
- Schools +5.4/10.0
- Livability +3.9/5.0
- DSCR +3.1/10.0
- 1% rule +2.7/10.0
- Rent growth +2.6/5.0
- Condition / age +2.5/5.0
- Appreciation +0.0/10.0
$415,000
🖨 Deal sheet 📄 Offer letter ✓ Due diligence
Listing remarks MLS
This is a really nice and spacious 2 BR 2 Bath unit with a Family Room and Large Enclosed California Room not included in the square footage that is currently being used as an Office. New Laminate Floors. Freshly painted inside and out. Open front porch to enjoy the wonderful breeze that comes through. Desirable location with no neighbors in front of you or behind you for privacy. Plenty of parking for friends and family. Mirrored Closet Doors in the Master Bedroom with his and her closets. This home has good bones. Many upgrades. BIG WHEELCHAIR RAMP IN THE CARPORT. 5 Year old roof. Blinds throughout. Central Air Conditioning and Heat. Good size manicured fenced back yard. Huge insulated storage shed with a ceiling fan and plenty of shelves. Nice and clean. Includes Washer and Dryer. Move in ready. Seller will pay for a One year Home Warranty for buyer. HOA will allow two small pets 20 pounds or less. More pics to come soon.
Key facts
- 2 parking spots
- Community pool
- Built 1972
Neighborhood map
What this means for you Summary
Snapshot
- This is a 2-bed/2.0-bath manufactured listed at $415k.
Deal economics
- At list price, monthly cash flow is $-187 ($-2k/yr) — negative.
- To cash-flow at today's rent, offer at most $382k (8.0% below list).
- To meet the 1% rule (rent ≥ 1% of price), the offer needs to be $320k (22.9% below list).
- Recommended offer: $320k (22.9% below list) — sets the bar for 1% rule.
- Cap rate 5.8% vs local median 2.5% in San Marcos — top-decile yield for the area; either an underpriced asset or a hidden risk that comps aren't pricing in. Stress-test before assuming the spread holds.
Location & tenants
- Location reads 77/100 on livability (#80 in CA, #3,074 nationally) — a middle-class / working-renter tenant base. Strengths: amenities A+, commute A+, employment A+; Watch: health & safety D+, cost of living F.
- San Marcos Unified (suburban): math 52% / reading 67% proficiency, ranked #249 of 1,400 in CA (top 18%) — acceptable for families but not a draw, mixed tenant base, ~2y average lease.
- Market conditions: Rents flat; 115 active listings in the ZIP; 15 comparable units currently listed for rent nearby; rentals leasing fast (median 5d on market — plan ~1-2 weeks tenant-placement turnaround); solid renter incomes; 11,759 units permitted in San Diego County in 2024 (7,244 in 5+ unit buildings).
- This rent runs 40% of the median local income ($97k/yr) — at the standard rent-burdened threshold; future hikes will face affordability resistance.
Forward outlook
- Local home prices are declining (-3.0%/yr); year-one equity from $3k of loan paydown is wiped out by about $12k of value loss. Plan a longer hold.
- San Diego County population projected at +20% by 2050 — long-run rental-demand tailwind backs the buy-and-hold thesis.
Negotiation context
- It's been on market 102 days — a 9% lower offer ($378k) is reasonable based on typical stale-listing flexibility.
- 3 sale attempts since 18y ago; this cycle's ask is 4% above the opening price — seller raised mid-cycle; expect resistance to lowballs.
- Current owner paid $150k; list at $415k implies a 177% gain — meaningful room to come down on a strong offer.
Risks & watch-outs
- Climate carrying-cost: major wildfire risk; extreme-heat days projected 7→21/yr by 2055 (HVAC capex compounding) — expect insurance premiums to compound above CPI over the hold.
Questions for the listing agent
- What do current leases actually rent for vs. the listed asking? Can we see a recent rent roll and the last 12 months of T-12 income?
- It's been on market 102 days. Have you received any prior offers? Is the seller open to a 23% concession, seller financing, or rate buy-down credit?
- Built in 1972 — when were the roof, HVAC, electrical panel, plumbing, and water heater last replaced?
- What does the HOA fee cover, when was the last increase, and are there any pending special assessments or reserve-fund shortfalls?
- Why hasn't it sold? Are there any deal-killer items the seller is aware of (foundation, flood, title, zoning, code violations)?
- Is there a deadline driving the sale (1031 exchange, divorce, estate, relocation)? That informs how much negotiation room exists.
- The area grade is low — what's the realistic commute time and amenity access for the typical tenant pool here? Any planned neighborhood developments (good or bad) we should know about?
- What's the average days-on-market for RENTAL listings here right now (not sales)? A rising rental-DOM trend means longer vacancies and softer asking-rent achievability than the comps imply.
- What's the recent tenant-quality profile in this submarket — average credit score on applications, eviction rate, late-payment / NSF rate, and stable-employment percentage? A property-management company in the area should have these aggregated.
- How much new for-sale + rental construction is in the pipeline within 1–3 miles? Heavy new supply typically softens prices + rents 12–24 months out; constrained supply supports both.
Investment metrics
- 1% rule
- 0.77% ✗
- Cap rate
- 5.75%
- Cash-on-cash
- -1.93%
- DSCR
- 0.91
- GRM
- 10.8
CMA / ARV
- ARV (median comp)
- $441,420
- List price
- $415,000
- Delta
- -5.99%
- Verdict
- FAIR
- Comps
- 19 within 1.0 mi
Show comp detail 12 sales within ~0.75 mi
| Address | Dist | Beds/Ba | Sqft | Sold | Price | $/sf | Match |
|---|---|---|---|---|---|---|---|
| 1401 El Norte Pkwy #57 | 0.00mi | 2/2.0 | 1,368 (-5%) | 2mo | $287,000 | $210 | 90 |
| 1401 El Norte Pkwy #9 | 0.00mi | 2/2.0 | 1,368 (-5%) | 9mo | $345,000 | $252 | 84 |
| 1401 El Norte Pkwy Spc 60 | 0.00mi | 2/2.0 | 1,560 (+8%) | 4mo | $441,420 | $283 | 83 |
| 1723 Kiwi Gln | 0.48mi | 2/2.0 | 1,440 (0%) | 3mo | $460,000 | $319 | 75 |
| 1401 El Norte Pkwy #42 | 0.00mi | 3/2.0 (+1) | 1,580 (+10%) | 8mo | $445,000 | $282 | 72 |
| 971 Borden Rd #2 | 0.59mi | 2/2.0 | 1,440 (0%) | 3mo | $260,000 | $181 | 70 |
| 1401 El Norte Pkwy Spc 237 | 0.00mi | 2/2.0 | 1,647 (+14%) | 8mo | $470,000 | $285 | 70 |
| 1401 El Norte Pkwy #217 | 0.00mi | 2/2.0 | 1,248 (-13%) | 10mo | $339,500 | $272 | 69 |
| 1609 Desert Gln | 0.56mi | 2/2.0 | 1,440 (0%) | 7mo | $495,000 | $344 | 68 |
| 971 Borden Rd #122 | 0.59mi | 3/2.0 (+1) | 1,401 (-3%) | 3mo | $375,000 | $268 | 60 |
| 1627 Toyon | 0.59mi | 2/2.0 | 1,344 (-7%) | 9mo | $450,000 | $335 | 54 |
| 1719 Kiwi Gln | 0.49mi | 2/2.0 | 1,248 (-13%) | 2mo | $420,000 | $337 | 53 |
Match score weights: distance 35% · size 25% · config 20% · recency 20%. Top-matched comps best support the ARV.
Projected returns pro-forma
-3.0% appreciation · 0.55% rent growth · sell at horizon
- IRR
- -22.1%
- Equity multiple
- 0.25×
- Total profit
- $-86,906
- Equity at exit
- $61,878
- IRR
- -23.1%
- Equity multiple
- -0.04×
- Total profit
- $-121,287
- Equity at exit
- $35,882
Cash invested: $116,200 (down + closing). Projections, not guarantees.
Landlord ↔ Tenant lean methodology
- Overall (STATE)
- 18 Strongly Tenant-Friendly
- State California
- 18 Strongly Tenant-Friendly · D+13
- County
- — inherits STATE
- City
- — inherits STATE
ZIP-level market 92069
- Rents YoY
- 0.6%
- Active inventory
- 115
- Price-to-rent
- 10.8×
Monthly cashflow live
- Estimated rent
- $3,201 high interval (Pro) →
- Mortgage (P&I)
- −$2,176
- Tax from tax record
- −$144 /mo · $1,731/yr
- Insurance
- −$173
- HOA
- −$222
- Vacancy / Maint / Mgmt
- −$672
- Net cashflow
- $-187
Break-even live
UW: 25.0% down · 7.5% · 30yr · 1.5% tax · 5.0% vac · 8.0% maint · 8.0% mgmt
Financing live
Cash to close
- Down payment
- $103,750
- Closing costs
- $12,450
- Reserves months
- —
- Total cash needed
- —
Loan-product check · same deal, 3 products live
Conventional
25% down · 7.5% · 30yr
- Down + closing
- —
- Monthly P&I
- —
- Monthly cashflow
- —
- DSCR
- —
- Eligible?
- —
Personal DTI + credit; lowest rate.
DSCR
20% down · 8.5% · 30yr
- Down + closing
- —
- Monthly P&I
- —
- Monthly cashflow
- —
- DSCR
- —
- Eligible?
- —
No personal income docs; deal must DSCR.
Hard money
10% down · 12.0% · 12mo
- Down + closing
- —
- Monthly P&I
- —
- Monthly cashflow
- —
- DSCR
- —
- Eligible?
- —
Short-term bridge; refi at stabilization.
Rent comps 15 comps
| Address | Beds | Baths | Sqft | Rent | $/sqft | DOM | Units | Dist |
|---|---|---|---|---|---|---|---|---|
| 975 Woodland Pkwy San Marcos, CA | 1.0–2.0 | 1.0–2.0 | 755 | $3,275 | $4.33 | 1d | 1 | 0.18mi |
| 1920 Edith Dr Escondido, CA | 2.0 | 2.0 | 1330 | $3,699 | $2.78 | 1d | 1 | 0.42mi |
| 909 Richland Rd San Marcos, CA | 2.0 | 2.0 | 1688 | $3,300 | $1.95 | 5d | 1 | 0.74mi |
| 909 Richland Rd #142 San Marcos, CA | 2.0 | 2.0 | 1688 | $3,500 | $2.07 | 24d | 1 | 0.74mi |
| 909 Richland Rd #89 San Marcos, CA | 2.0 | 2.0 | 1440 | $2,800 | $1.94 | 43d | 1 | 0.74mi |
| 452 Lynwood Ln San Marcos, CA | 3.0 | 2.0 | 1000 | $3,250 | $3.25 | 43d | 1 | 0.79mi |
| 786 Fulton Rd San Marcos, CA | 3.0 | 2.0 | 1821 | $3,895 | $2.14 | 43d | 1 | 1.00mi |
| 218 Woodland Pkwy #146 San Marcos, CA | 2.0 | 2.0 | 908 | $2,900 | $3.19 | 43d | 1 | 1.09mi |
| 1113 Privet St San Marcos, CA | 2.0 | 2.0 | 1008 | $2,595 | $2.57 | 24d | 1 | 1.12mi |
| 1898 Matin Cir #189 San Marcos, CA | 2.0 | 2.0 | 1001 | $3,195 | $3.19 | 43d | 1 | 1.20mi |
| 131 Avenida Chapala #105 San Marcos, CA | 3.0 | 2.5 | 1379 | $3,425 | $2.48 | 2d | 1 | 1.21mi |
| 852 Avenida Ricardo San Marcos, CA | 1.0–2.0 | 1.0–2.0 | 784 | $4,081 | $5.21 | 1d | 13 | 1.22mi |
| 823 Nordahl Rd San Marcos, CA | 1.0–3.0 | 1.0–2.0 | 887 | $2,808 | $3.17 | 2d | 1 | 1.33mi |
| 1051 W El Norte Pkwy Escondido, CA | 1.0–2.0 | 1.0–2.0 | 800 | $2,561 | $3.20 | 1d | 6 | 1.39mi |
| 2000 Montego Ave Escondido, CA | 1.0–2.0 | 1.0–2.0 | 890 | $2,326 | $2.61 | 1d | 1 | 1.42mi |
HOA detail
- Monthly dues
- $222 · $2,664/yr
Listing history 25 events
-
2026-06-18days on market $415,000 Active 102 DOM
-
2026-06-17days on market $415,000 Active 101 DOM
-
2026-06-16days on market $415,000 Active 100 DOM
-
2026-06-15pricedays on market $415,000 Active 99 DOM
-
2026-06-13days on market $398,000 Active 97 DOM
-
2026-06-09days on market $398,000 Active 93 DOM
-
2026-06-08days on market $398,000 Active 92 DOM
-
2026-06-07days on market $398,000 Active 91 DOM
-
2026-06-04days on market $398,000 Active 88 DOM
-
2026-06-03days on market $398,000 Active 87 DOM
-
2026-06-02days on market $398,000 Active 86 DOM
-
2026-06-01days on market $398,000 Active 85 DOM
-
2026-05-31days on market $398,000 Active 84 DOM
-
2026-03-08$398,000 Active 938-char remark
Show marketing remark (938 chars)
This is a really nice and spacious 2 BR 2 Bath unit with a Family Room and Large Enclosed California Room not included in the square footage that is currently being used as an Office. New Laminate Floors. Freshly painted inside and out. Open front porch to enjoy the wonderful breeze that comes through. Desirable location with no neighbors in front of you or behind you for privacy. Plenty of parking for friends and family. Mirrored Closet Doors in the Master Bedroom with his and her closets. This home has good bones. Many upgrades. BIG WHEELCHAIR RAMP IN THE CARPORT. 5 Year old roof. Blinds throughout. Central Air Conditioning and Heat. Good size manicured fenced back yard. Huge insulated storage shed with a ceiling fan and plenty of shelves. Nice and clean. Includes Washer and Dryer. Move in ready. Seller will pay for a One year Home Warranty for buyer. HOA will allow two small pets 20 pounds or less. More pics to come soon.
-
2026-03-01historical $398,000 938-char remark
Show marketing remark (938 chars)
This is a really nice and spacious 2 BR 2 Bath unit with a Family Room and Large Enclosed California Room not included in the square footage that is currently being used as an Office. New Laminate Floors. Freshly painted inside and out. Open front porch to enjoy the wonderful breeze that comes through. Desirable location with no neighbors in front of you or behind you for privacy. Plenty of parking for friends and family. Mirrored Closet Doors in the Master Bedroom with his and her closets. This home has good bones. Many upgrades. BIG WHEELCHAIR RAMP IN THE CARPORT. 5 Year old roof. Blinds throughout. Central Air Conditioning and Heat. Good size manicured fenced back yard. Huge insulated storage shed with a ceiling fan and plenty of shelves. Nice and clean. Includes Washer and Dryer. Move in ready. Seller will pay for a One year Home Warranty for buyer. HOA will allow two small pets 20 pounds or less. More pics to come soon.
-
2021-04-21historical
-
2021-04-20historical
-
2017-06-22soldstatus $150,000
-
2009-12-04historical
-
2009-12-04historical
-
2009-04-30price $128,000
-
2008-12-03$128,000
-
2008-12-03$128,000
-
1996-01-26soldstatus $35,000
-
1985-12-24soldstatus $22,500
ⓘ Source: listings_history table (triggers on properties + properties_extension) + one-shot
backfill from property_details.listing_events for pre-trigger history.
Tax reassessment forecast CA · Resets to sale price
- Current annual tax
- $1,731 · $144/mo
- Projected year-2 tax
- $3,154 · $263/mo
- Expected delta
- +$1,423/yr (+$119/mo · 82.2%)
ⓘ Screening estimate from a state-policy table — verify with the county assessor before closing.
Climate risk First Street
- Flood 4/10 Moderate FEMA zone X (unshaded) · 22% chance over 30 yrs
- Wildfire 6/10 Major
- Heat 5/10 Major 7 d/yr ≥97°F today · 21 d/yr by 30 yrs out
- Wind 1/10 Low
- Air quality 3/10 Moderate 4 unhealthy d/yr today · 4 by 30 yrs out
Nearby sold comps map
Loading sold comps map…
Walkable amenities ~0.75 mi
Loading nearby amenities…
Taxation est. · year 1
- Rental income
- $38,407
- − Mortgage interest
- −$23,246
- − Property taxes
- −$1,731
- − Insurance
- −$2,075
- − Repairs & maintenance
- −$3,073
- − Management
- −$3,073
- − HOA
- −$2,664
- − Depreciation
- −$12,073
- Taxable loss
- −$9,527
- Est. tax savings @ 24.0%
- +$2,287
- After-tax cash flow
- $42/yr
For passive investors: Depreciation is non-cash, so a rental often shows a tax loss while cash-flowing — sheltering income. Rental losses are passive: they offset passive income freely, and up to $25,000/yr can offset ordinary (W-2) income if you actively participate and your MAGI is under $100k (phasing out to $0 by $150k); unused losses carry forward. On sale, claimed depreciation is recaptured at up to 25%, and gains may owe capital-gains tax (a 1031 exchange can defer both). Figures are a year-1 estimate at your 24.0% rate — not tax advice; consult a CPA.
Schools (NCES district)
- District
- San Marcos Unified
- NCES district ID
- 0634880
- Math proficiency
- 52% ▲ 1.00%
- Reading proficiency
- 67% ▲ 2.00%
- Median HH income
- $64,752
- Composite
- 53.67/100
- National rank
- #3093
- State rank
- #249 of 1400 in CA
Livability — San Marcos
- Score
- 77/100
- State rank
- #80
- US rank
- #3074
Category grades
Schools grade is shown separately in the Schools card above.
Census & demographics
- Census place
- San Marcos, CA
- County
- San Diego County · 3,178,799 people
- City population
- 100,940
- Metro
- San Diego-Chula Vista-Carlsbad, CA
- Population (ZIP)
- 47,335
- Household income
- $96,771
- Rent vs Own
- Severe rent burden
- 2399.0
Population outlook (San Diego County) Hauer SSP2
- Today (2025)
- 3,678,185 people
- By 2030
- 3,856,546 · +4.8%
- By 2040
- 4,171,407 · +13.4%
- By 2050
- 4,421,607 · +20.2%
- By 2075
- 4,831,599 · +31.4%
- By 2100
- 4,832,502 · +31.4%
Race, ethnicity, and origin ACS 2023
- Neighborhood character
- Diverse neighborhood (Simpson 0.64)
- Race & ethnicity
- Hispanic / Latino 46% White 36% Two or more races 20% Asian 11% Native American 1% Black 1%
- Hispanic origin (detail)
- Mexican 41%
- Common ancestry
- Lithuanian 2% Romanian 2% Portuguese 2%
- Foreign-born
- 26% · Canada, China, Vietnam
- Languages at home
- 57% English-only · Spanish 32% Tagalog/Filipino 2% Other Asian/Pacific 2%
Political lean MEDSL · San Diego
- 2024 margin
- D (+16.8) · D 56.9% · R 40.1% · Other 2.9%
- 2008→2024 swing
- +6.6pp toward D · 2008: 10.2pp · 2024: 16.8pp
- All cycles
- 2024: D+16.8 2020: D+22.8 2016: D+17.8 2012: D+5.1 2008: D+10.2
Not yet ingested
- Civics
- —
Market trends
- HPI YoY
- ▼ -522.69%
- Current HPI
- 376.182
- Rent YoY
- ▲ 0.55%
- Metro
- San Diego-Chula Vista-Carlsbad, CA
- State GDP YoY
- ▲ 3.21%
- F500 in state
- 116
Industry mix (Fortune 500 HQ in CA)
| Industry | F500 HQs | Revenue |
|---|---|---|
| Technology | 27 | $1,492B |
|
||
| Financial Services | 3 | $174B |
|
||
| Retail | 3 | $44B |
|
||
| Insurance | 3 | $26B |
|
||
| Media / Entertainment | 2 | $115B |
|
||
| Pharmaceuticals / Biotech | 2 | $62B |
|
||
Price history
+1668.9% since first listed12 events — show timeline
- 2026-03-08 Listed $398,000 CRMLS
- 2026-03-01 Coming Soon $398,000 CRMLS
- 2021-04-21 Coming Soon — CRMLS
- 2021-04-20 Listing Removed — CRMLS
- 2017-06-22 Sold (Public Records) $150,000 Public Records
- 2009-12-04 Listing Removed — CRMLS
- 2009-12-04 Listing Removed — SDMLS
- 2009-04-30 Price Changed $128,000 SDMLS
- 2008-12-03 Listed $128,000 CRMLS
- 2008-12-03 Listed $128,000 SDMLS
- 1996-01-26 Sold (Public Records) $35,000 Public Records
- 1985-12-24 Sold (Public Records) $22,500 Public Records
Property tax history
+8.8%/yrLatest (2025): $1,731 · +5.6% YoY. Source: county tax records.
Cash-flow waterfall
monthlySold comps — $/sqft
last 12 mo · ≤1 miLoading sold comps…