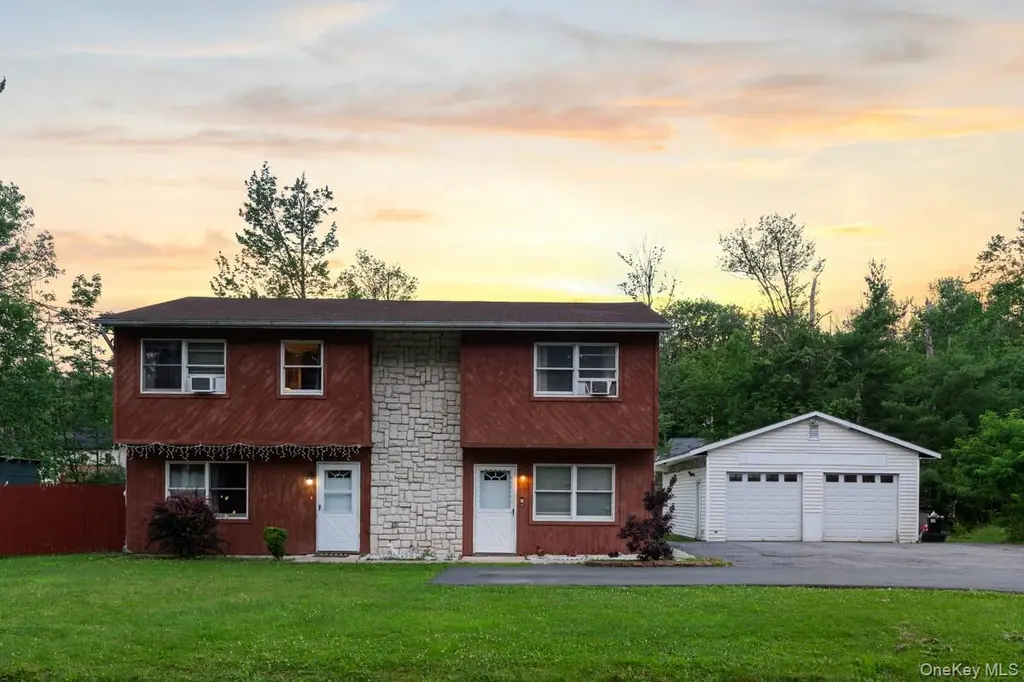
162 Park Ave
Monticello, NY 12701
$449,000C-
5 bd · 3.0 ba ·
2,246 sqft ·
Built 1985
· MultiFamily
· Pending
· 39 DOM
Cashflow @ list (25.0% down · 7.5%)
Estimated rent
$3,876/mo
Mortgage (P&I)
−$2,355
Tax + insurance
−$800
HOA
−$0
Vac / Maint / Mgmt
−$814
Net cashflow
$-92/mo
Annual
$-1,105/yr
Cap rate
6.05%
Cash-on-cash
-0.88%
DSCR
0.96
1% rule
0.86%
Cash to close
$125,720
Investor read
- This is a 2 × 2-bed/2.0-bath units multifamily listed at $449k.
- At list price, monthly cash flow is $-92 ($-1k/yr) — negative. Per door: $-46/mo.
- To cash-flow at today's rent, offer at most $433k (3.6% below list).
- To meet the 1% rule (rent ≥ 1% of price), the offer needs to be $388k (13.7% below list).
- It's been on market 39 days — a 3% lower offer ($436k) is reasonable based on typical stale-listing flexibility.
- Recommended offer: $388k (13.7% below list) — sets the bar for 1% rule.
- In year one you build about $48k of equity ($3k loan paydown + $45k appreciation (10.0% local appreciation)).
- Location reads 61/100 on livability (#899 in NY) — a middle-class / working-renter tenant base. Strengths: housing A+, cost of living A-; Watch: crime D, amenities F, commute F.
- Monticello Central School District (town): math 29% / reading 30% proficiency, ranked #577 of 590 in NY (top 98%) — low school quality limits family demand, transient renter base, plan for 1-2y turnover.
- Zoned schools: George L Cooke School (592 students, 71% FRL); Robert J Kaiser Middle School (math 7% / reading 35%, grade F, #661 of 729 statewide, top 91%, 595 students, 66% FRL); Monticello High School (math 82% / reading 34%, grade C, #879 of 1,100 statewide, top 80%, 844 students, 63% FRL) — zoned schools average 67% FRL vs 50% district-wide (16 pts higher); higher-poverty schools than district average — tighter screening recommended.
- Market conditions: 186 active listings in the ZIP; 739 units permitted in Sullivan County in 2024 (5 in 5+ unit buildings).
- Sullivan County population projected at -24% by 2050 — secular population decline; favor cash flow + early exit over multi-decade hold.
- 5 sale attempts with the ask held roughly flat each time — persistent listings suggest the price (not the market) is what's stuck; bring a comps-based counter.
- By year 2, paydown + projected appreciation supports a ~$77k cash-out refi (75% LTV) — recoverable capital for the next deal without selling this one.
- Cap rate 6.0% vs local median 3.4% in Monticello — top-decile yield for the area; either an underpriced asset or a hidden risk that comps aren't pricing in. Stress-test before assuming the spread holds.
- At $3,876/mo this rent would consume 81% of the median local household income ($57k/yr) (locally 814% of renters already pay >50% of income on rent) — very limited rent-growth headroom before tenants either downsize or default.
Questions for listing agent
- What do current leases actually rent for vs. the listed asking? Can we see a recent rent roll and the last 12 months of T-12 income?
- It's been on market 39 days. Have you received any prior offers? Is the seller open to a 14% concession, seller financing, or rate buy-down credit?
- Can we see the unit-by-unit rent roll, current vacancy, and any below-market leases? What's the average tenancy length?
- What capital expenditures (roof, boiler, parking lot, exteriors) have been made in the last 5 years, and what's planned in the next 2?
- Is there a deadline driving the sale (1031 exchange, divorce, estate, relocation)? That informs how much negotiation room exists.
- Schools are F-rated, which usually means shorter tenancies and higher turnover. Who's the typical renter profile here, and what's been the actual vacancy rate?
- Crime grade is D in this area — have there been break-ins, vandalism, or insurance claims at this property in the last 3 years? What carrier currently insures it and at what premium?
- What's the average days-on-market for RENTAL listings here right now (not sales)? A rising rental-DOM trend means longer vacancies and softer asking-rent achievability than the comps imply.
CashFlowRE · CFR-SCK1GV94XT8RDF
· Data 2 weeks ago
cashflowre.app · 2026-05-29