 Duplex
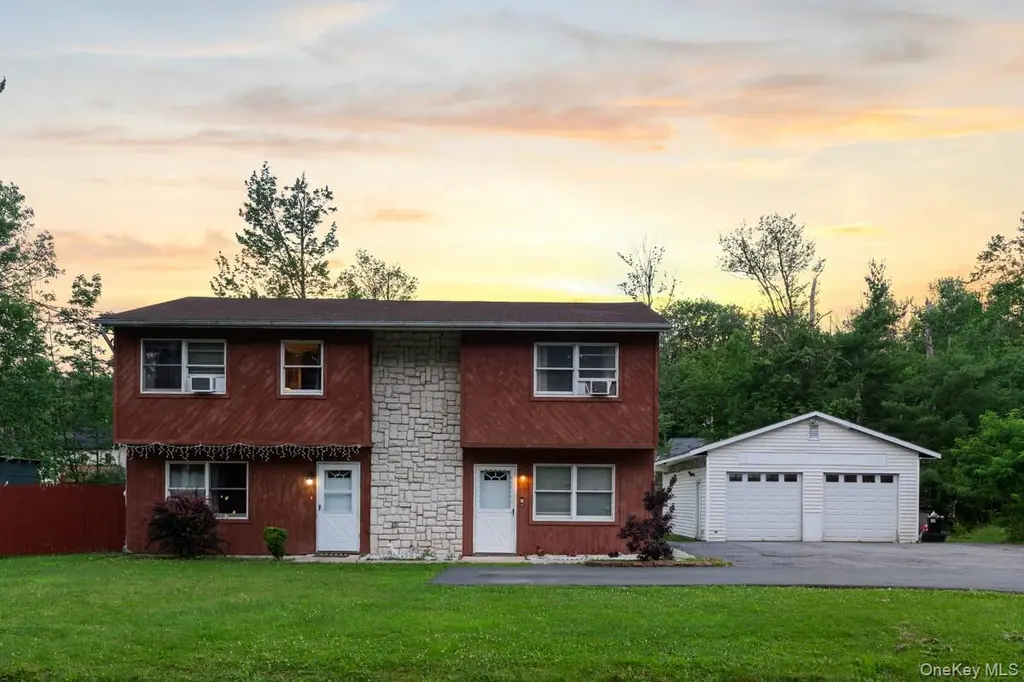
162 Park Ave · Monticello, NY
Flood risk 1/10 · Minimal
- FEMA flood zone
- X (unshaded)
- Chance of flooding over 30 yrs
- 0.0%
- Est. flood insurance / yr
- $507 – $1,088
Fire risk 2/10 · Minimal
- Est. fire insurance / yr
- $691 – $1,283
Heat risk 2/10 · Minimal
- Hot days now (above 92°F)
- 7 days/yr
- Hot days in 30 yrs
- 15 days/yr
Wind risk 3/10 · Minor
- Chance of severe wind over 30 yrs
- 5.0%
Air-quality risk 2/10 · Minimal
- Unhealthy air days now
- 1 days/yr
- Unhealthy air days in 30 yrs
- 1 days/yr
Risk factors via First Street. Map © Google.
Why this score? — see what drove the C- grade
The composite is a weighted blend of 9 inputs, each scored 0–100. Each bar is that input's sub-score; the figure is the points it added to the 100-point composite (weight × sub-score).
- ARV discount +12.5/15.0
- Cash flow +12.2/30.0
- Appreciation +10.0/10.0
- 1% rule +3.6/10.0
- DSCR +3.6/10.0
- Livability +3.1/5.0
- Rent growth +2.5/5.0
- Schools +2.5/10.0
- Condition / age +2.5/5.0
$449,000
🖨 Deal sheet 📄 Offer letter ✓ Due diligence
Multi-family units
County records classify this as Multi-Family (2-4 Unit). Listing-text estimate: 2 units. confirmed
Listing remarks
Fantastic opportunity in the Village of Monticello—perfect for both end users and savvy investors! This legal 2-family home is ideally located in the center of town, just minutes from shopping, restaurants, popular stores, public transportation, and all local conveniences. Whether you choose to live in one unit and rent out the other or use both as income-producing units, this property offers flexibility, stability, and a great ROI. The home features updated kitchens and bathrooms, spacious layouts, and has been meticulously maintained, making it a true turn-key opportunity. Both units are currently occupied by great long-term tenants who are responsible for their own utilities, thank
Key facts
- Spacious layouts
- Legal 2-family home
- Updated bathrooms
Tags
Property features AI
Finance
- Financial info: Tax year 2024
Exterior
- Parking: Driveway; 2-car garage
- Utilities: Electric service by NYSEG; Public sewer; Cable available; Phone available; Electricity connected; Sewer connected
- Home design: Duplex; Total building area approximately 2246; Property faces unspecified direction
- Construction: Vinyl siding construction
- Exterior features: Patio; Not waterfront; Vinyl siding
Interior
- Bedrooms: Duplex includes one 2-bedroom unit and one 3-bedroom unit
- Bathrooms: Four full bathrooms
- Heating & cooling: Baseboard heating; Wall/window air conditioning units
- Interior features: Washer/dryer hookup; Patio
- Laundry & utility: Washer/dryer hookup
Neighborhood map
What this means for you Summary
Snapshot
- This is a 2 × 2-bed/2.0-bath units multifamily listed at $449k.
Deal economics
- At list price, monthly cash flow is $-92 ($-1k/yr) — negative. Per door: $-46/mo.
- To cash-flow at today's rent, offer at most $433k (3.6% below list).
- To meet the 1% rule (rent ≥ 1% of price), the offer needs to be $388k (13.7% below list).
- Recommended offer: $388k (13.7% below list) — sets the bar for 1% rule.
- Cap rate 6.0% vs local median 3.4% in Monticello — top-decile yield for the area; either an underpriced asset or a hidden risk that comps aren't pricing in. Stress-test before assuming the spread holds.
Location & tenants
- Location reads 61/100 on livability (#899 in NY) — a middle-class / working-renter tenant base. Strengths: housing A+, cost of living A-; Watch: crime D, amenities F, commute F.
- Monticello Central School District (town): math 29% / reading 30% proficiency, ranked #577 of 590 in NY (top 98%) — low school quality limits family demand, transient renter base, plan for 1-2y turnover.
- Zoned schools: George L Cooke School (592 students, 71% FRL); Robert J Kaiser Middle School (math 7% / reading 35%, grade F, #661 of 729 statewide, top 91%, 595 students, 66% FRL); Monticello High School (math 82% / reading 34%, grade C, #879 of 1,100 statewide, top 80%, 844 students, 63% FRL) — zoned schools average 67% FRL vs 50% district-wide (16 pts higher); higher-poverty schools than district average — tighter screening recommended.
- Market conditions: 186 active listings in the ZIP; 739 units permitted in Sullivan County in 2024 (5 in 5+ unit buildings).
- At $3,876/mo this rent would consume 81% of the median local household income ($57k/yr) (locally 814% of renters already pay >50% of income on rent) — very limited rent-growth headroom before tenants either downsize or default.
Forward outlook
- In year one you build about $48k of equity ($3k loan paydown + $45k appreciation (10.0% local appreciation)).
- Sullivan County population projected at -24% by 2050 — secular population decline; favor cash flow + early exit over multi-decade hold.
- By year 2, paydown + projected appreciation supports a ~$77k cash-out refi (75% LTV) — recoverable capital for the next deal without selling this one.
Negotiation context
- It's been on market 39 days — a 3% lower offer ($436k) is reasonable based on typical stale-listing flexibility.
- 5 sale attempts with the ask held roughly flat each time — persistent listings suggest the price (not the market) is what's stuck; bring a comps-based counter.
Questions for the listing agent
- What do current leases actually rent for vs. the listed asking? Can we see a recent rent roll and the last 12 months of T-12 income?
- It's been on market 39 days. Have you received any prior offers? Is the seller open to a 14% concession, seller financing, or rate buy-down credit?
- Can we see the unit-by-unit rent roll, current vacancy, and any below-market leases? What's the average tenancy length?
- What capital expenditures (roof, boiler, parking lot, exteriors) have been made in the last 5 years, and what's planned in the next 2?
- Is there a deadline driving the sale (1031 exchange, divorce, estate, relocation)? That informs how much negotiation room exists.
- Schools are F-rated, which usually means shorter tenancies and higher turnover. Who's the typical renter profile here, and what's been the actual vacancy rate?
- Crime grade is D in this area — have there been break-ins, vandalism, or insurance claims at this property in the last 3 years? What carrier currently insures it and at what premium?
- What's the average days-on-market for RENTAL listings here right now (not sales)? A rising rental-DOM trend means longer vacancies and softer asking-rent achievability than the comps imply.
- What's the recent tenant-quality profile in this submarket — average credit score on applications, eviction rate, late-payment / NSF rate, and stable-employment percentage? A property-management company in the area should have these aggregated.
- How much new apartment / multifamily construction is in the pipeline within 1–3 miles? Heavy new supply (>2% of stock underway) typically softens rents 12–24 months out; light construction supports rent growth.
Investment metrics
- 1% rule
- 0.86% ✗
- Cap rate
- 6.05%
- Cash-on-cash
- -0.88%
- DSCR
- 0.96
- GRM
- 9.7
CMA / ARV
- ARV (median comp)
- $504,918
- List price
- $449,000
- Delta
- -11.07%
- Verdict
- UNDERPRICED
- Comps
- 10 within 1.0 mi
Projected returns pro-forma
10.0% appreciation · 3.0% rent growth · sell at horizon
- IRR
- 23.7%
- Equity multiple
- 2.90×
- Total profit
- $238,763
- Equity at exit
- $404,495
- IRR
- 21.0%
- Equity multiple
- 6.63×
- Total profit
- $707,908
- Equity at exit
- $872,308
Cash invested: $125,720 (down + closing). Projections, not guarantees.
Landlord ↔ Tenant lean methodology
- Overall (STATE)
- 15 Strongly Tenant-Friendly
- State New York
- 15 Strongly Tenant-Friendly · D+10
- County
- — inherits STATE
- City
- — inherits STATE
ZIP-level market 12701
- Home prices YoY
- 16.7%
- Active inventory
- 186
- Price-to-rent
- 19.3×
Monthly cashflow live
- Estimated rent
- $3,876 high interval (Pro) →
- Mortgage (P&I)
- −$2,355
- Tax from tax record
- −$612 /mo · $7,349/yr
- Insurance
- −$187
- HOA
- −$0
- Vacancy / Maint / Mgmt
- −$814
- Net cashflow
- $-92
Break-even live
2-unit breakdown (identical units grouped — click to expand)
| Units | Beds | Baths | Est. rent |
|---|---|---|---|
| 2× units | 2 | 2 | $3,876 |
| #1 | 2 | 2 | $1,938 |
| #2 | 2 | 2 | $1,938 |
| Total (2 units) | $3,876 | ||
UW: 25.0% down · 7.5% · 30yr · 1.5% tax · 5.0% vac · 8.0% maint · 8.0% mgmt
Financing live
Cash to close
- Down payment
- $112,250
- Closing costs
- $13,470
- Reserves months
- —
- Total cash needed
- —
Loan-product check · same deal, 3 products live
Conventional
25% down · 7.5% · 30yr
- Down + closing
- —
- Monthly P&I
- —
- Monthly cashflow
- —
- DSCR
- —
- Eligible?
- —
Personal DTI + credit; lowest rate.
DSCR
20% down · 8.5% · 30yr
- Down + closing
- —
- Monthly P&I
- —
- Monthly cashflow
- —
- DSCR
- —
- Eligible?
- —
No personal income docs; deal must DSCR.
Hard money
10% down · 12.0% · 12mo
- Down + closing
- —
- Monthly P&I
- —
- Monthly cashflow
- —
- DSCR
- —
- Eligible?
- —
Short-term bridge; refi at stabilization.
Listing history 20 events
-
2026-06-03status $449,000 Pending 39 DOM
-
2026-06-02days on market $449,000 Active 39 DOM
-
2026-06-01days on market $449,000 Active 38 DOM
-
2026-05-31days on market $449,000 Active 37 DOM
-
2026-05-31days on market $449,000 Active 36 DOM
-
2026-04-24$449,000 Active 909-char remark
-
2026-04-19$459,999 Active
-
2025-11-02$449,000 Active
-
2025-10-31historical
-
2025-08-24historical
-
2025-07-11$475,000 Active
-
2025-07-09historical
-
2025-06-30historical
-
2025-05-22$479,999 Active
-
2025-03-17soldstatus $444,444
-
2005-07-07soldstatus $158,500
-
2002-10-16soldstatus $80,000
-
2000-09-27soldstatus $23,500
-
1994-11-15soldstatus $79,000
-
1993-03-08soldstatus $95,344
ⓘ Source: listings_history table (triggers on properties + properties_extension) + one-shot
backfill from property_details.listing_events for pre-trigger history.
Tax reassessment forecast NY · Partial reset (capped growth)
- Current annual tax
- $7,349 · $612/mo
- Projected year-2 tax
- $7,469 · $622/mo
- Expected delta
- +$120/yr (+$10/mo · 1.6%)
ⓘ Screening estimate from a state-policy table — verify with the county assessor before closing.
Climate risk First Street
- Flood 1/10 Low FEMA zone X (unshaded) · 0% chance over 30 yrs
- Wildfire 2/10 Low
- Heat 2/10 Low 7 d/yr ≥92°F today · 15 d/yr by 30 yrs out
- Wind 3/10 Moderate 5% chance of damaging wind over 30 yrs
- Air quality 2/10 Low 1 unhealthy d/yr today · 1 by 30 yrs out
Nearby sold comps map
Loading sold comps map…
Walkable amenities ~0.75 mi
Loading nearby amenities…
Taxation est. · year 1
- Rental income
- $46,512
- − Mortgage interest
- −$25,151
- − Property taxes
- −$7,349
- − Insurance
- −$2,245
- − Repairs & maintenance
- −$3,721
- − Management
- −$3,721
- − Depreciation
- −$13,062
- Taxable loss
- −$8,737
- Est. tax savings @ 24.0%
- +$2,097
- After-tax cash flow
- $992/yr
For passive investors: Depreciation is non-cash, so a rental often shows a tax loss while cash-flowing — sheltering income. Rental losses are passive: they offset passive income freely, and up to $25,000/yr can offset ordinary (W-2) income if you actively participate and your MAGI is under $100k (phasing out to $0 by $150k); unused losses carry forward. On sale, claimed depreciation is recaptured at up to 25%, and gains may owe capital-gains tax (a 1031 exchange can defer both). Figures are a year-1 estimate at your 24.0% rate — not tax advice; consult a CPA.
Schools (NCES district)
- District
- Monticello Central School District
- NCES district ID
- 3619740
- Math proficiency
- 29% ▼ -4.00%
- Reading proficiency
- 30% ▼ -2.00%
- Median HH income
- $44,696
- Composite
- 25.28/100
- National rank
- #7491
- State rank
- #577 of 590 in NY
Livability — Monticello
- Score
- 61/100
- State rank
- #899
- US rank
- #17510
Category grades
Schools grade is shown separately in the Schools card above.
Census & demographics
- Census place
- Monticello, NY
- County
- Sullivan County · 12,197 people
- City population
- 12,197
- Metro
- nan
- Population (ZIP)
- 12,197
- Household income
- $57,222
- Rent vs Own
- Severe rent burden
- 814.0
Population outlook (Sullivan County) Hauer SSP2
- Today (2025)
- 68,974 people
- By 2030
- 65,609 · -4.9%
- By 2040
- 58,878 · -14.6%
- By 2050
- 52,500 · -23.9%
- By 2075
- 39,941 · -42.1%
- By 2100
- 28,880 · -58.1%
Race, ethnicity, and origin ACS 2023
- Neighborhood character
- Diverse neighborhood (Simpson 0.69)
- Race & ethnicity
- White 43% Hispanic / Latino 31% Black 15% Two or more races 15% Asian 5%
- Hispanic origin (detail)
- Mexican 1% Puerto Rican 19% Dominican 3%
- Common ancestry
- Scotch-Irish 3% Romanian 2% Iranian 1%
- Foreign-born
- 15% · Canada, China, Jamaica
- Languages at home
- 71% English-only · Spanish 20% Other Indo-European 3% Russian/Polish/Slavic 2%
Political lean MEDSL · Sullivan
- 2024 margin
- R (+16.7) · D 41.6% · R 58.4%
- 2008→2024 swing
- -26.2pp toward R · 2008: 9.5pp · 2024: -16.7pp
- All cycles
- 2024: R+16.7 2020: R+9.2 2016: R+13.7 2012: D+10.4 2008: D+9.5
Not yet ingested
- Civics
- —
Market trends
- HPI YoY
- ▲ 72.71%
- Current HPI
- 507.739
- Rent YoY
- —
- Metro
- nan
- State GDP YoY
- ▲ 2.60%
- F500 in state
- 92
Industry mix (Fortune 500 HQ in NY)
| Industry | F500 HQs | Revenue |
|---|---|---|
| Financial Services | 10 | $950B |
|
||
| Consumer Goods | 9 | $162B |
|
||
| Insurance | 4 | $225B |
|
||
| Telecommunications | 2 | $144B |
|
||
| Pharmaceuticals | 2 | $112B |
|
||
| Media / Entertainment | 2 | $69B |
|
||
Price history
+370.9% since first listed16 events — show timeline
- 2026-06-02 Pending — OneKey® MLS as Distributed by MLS Grid
- 2026-04-24 Listed $449,000 OneKey® MLS as Distributed by MLS Grid
- 2026-04-19 Listed $459,999 OneKey® MLS as Distributed by MLS Grid
- 2025-11-02 Listed $449,000 OneKey® MLS as Distributed by MLS Grid
- 2025-10-31 Coming Soon — OneKey® MLS as Distributed by MLS Grid
- 2025-08-24 Listing Removed — OneKey® MLS as Distributed by MLS Grid
- 2025-07-11 Listed $475,000 OneKey® MLS as Distributed by MLS Grid
- 2025-07-09 Coming Soon — OneKey® MLS as Distributed by MLS Grid
- 2025-06-30 Listing Removed — OneKey® MLS as Distributed by MLS Grid
- 2025-05-22 Listed $479,999 OneKey® MLS as Distributed by MLS Grid
- 2025-03-17 Sold (Public Records) $444,444 Public Records
- 2005-07-07 Sold (Public Records) $158,500 Public Records
- 2002-10-16 Sold (Public Records) $80,000 Public Records
- 2000-09-27 Sold (Public Records) $23,500 Public Records
- 1994-11-15 Sold (Public Records) $79,000 Public Records
- 1993-03-08 Sold (Public Records) $95,344 Public Records
Property tax history
+1.2%/yrLatest (2025): $7,349 · +5.6% YoY. Source: county tax records.
Cash-flow waterfall
monthlySold comps — $/sqft
last 12 mo · ≤1 miLoading sold comps…