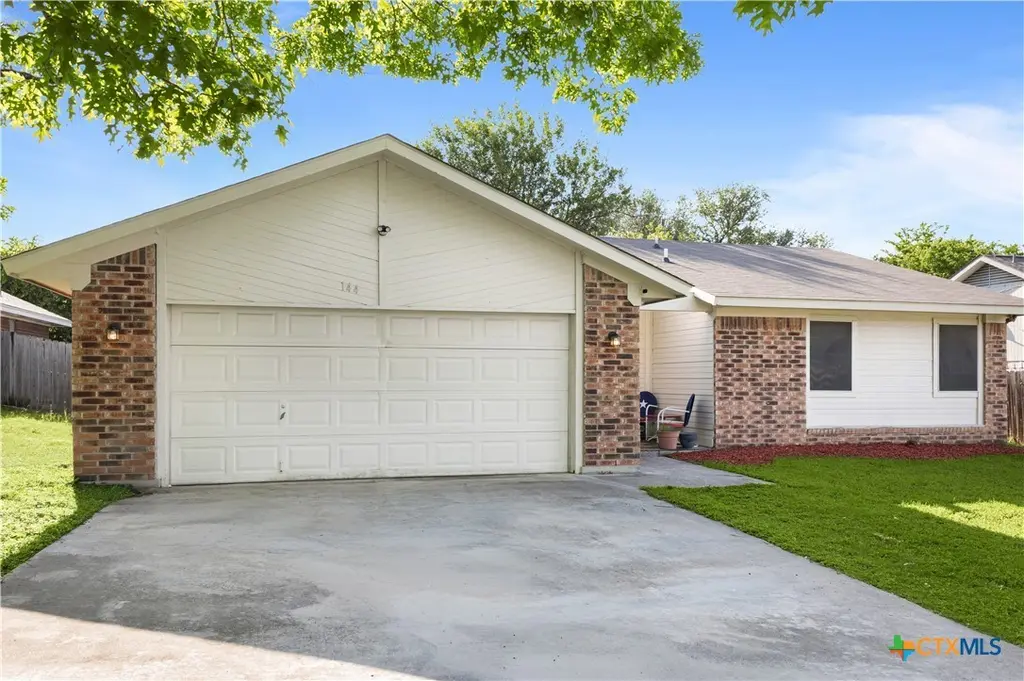
144 Jordan Loop
Nolanville, TX 76559
$207,000D
3 bd · 2.0 ba ·
1,266 sqft ·
Built 1986
· SingleFamily
· Active
· 37 DOM
Cashflow @ list (25.0% down · 7.5%)
Estimated rent
$1,443/mo
Mortgage (P&I)
−$1,086
Tax + insurance
−$388
HOA
−$0
Vac / Maint / Mgmt
−$303
Net cashflow
$-334/mo
Annual
$-4,006/yr
Cap rate
4.36%
Cash-on-cash
-6.91%
DSCR
0.69
1% rule
0.70%
Cash to close
$57,960
Investor read
- This is a 3-bed/2.0-bath single-family listed at $207k.
- At list price, monthly cash flow is $-334 ($-4k/yr) — negative.
- To cash-flow at today's rent, offer at most $148k (28.5% below list).
- To meet the 1% rule (rent ≥ 1% of price), the offer needs to be $144k (30.3% below list).
- It's been on market 37 days — a 3% lower offer ($201k) is reasonable based on typical stale-listing flexibility.
- Recommended offer: $144k (30.3% below list) — sets the bar for 1% rule.
- In year one you build about $2k of equity ($1k loan paydown + $77 appreciation (0.0% local appreciation)).
- Location reads 74/100 on livability (#176 in TX, #4,655 nationally) — a middle-class / working-renter tenant base. Strengths: crime A+, cost of living A+, housing A+; Watch: schools D+, amenities F, commute F.
- Killeen ISD (urban): math 31% / reading 38% proficiency, ranked #524 of 826 in TX (top 63%) — families likely to look elsewhere, expect single-tenant / working-renter base with shorter leases.
- Market conditions: 235 active listings in the ZIP; 40 comparable units currently listed for rent nearby; rentals lingering (median 44d on market — plan ~5-8 weeks vacancy on turnover, expect pricing pressure); 52% of comp listings sitting > 30 days — soft ceiling on asking rent; 3,222 units permitted in Bell County in 2024 (246 in 5+ unit buildings).
- Bell County population projected at +21% by 2050 — long-run rental-demand tailwind backs the buy-and-hold thesis.
- 9 sale attempts since 21y ago with the ask held roughly flat each time — persistent listings suggest the price (not the market) is what's stuck; bring a comps-based counter.
- Current owner paid $88k; list at $207k implies a 137% gain — meaningful room to come down on a strong offer.
- Climate carrying-cost: major wind risk, 62% chance of damaging wind over 30y; extreme-heat days projected 7→25/yr by 2055 (HVAC capex compounding) — expect insurance premiums to compound above CPI over the hold.
- Cap rate 4.4% vs local median 3.4% in Nolanville — meaningfully above typical; check what's discounted (condition, days-on-market, listing class) to confirm the premium yield is real.
Questions for listing agent
- What do current leases actually rent for vs. the listed asking? Can we see a recent rent roll and the last 12 months of T-12 income?
- It's been on market 37 days. Have you received any prior offers? Is the seller open to a 30% concession, seller financing, or rate buy-down credit?
- Is there a deadline driving the sale (1031 exchange, divorce, estate, relocation)? That informs how much negotiation room exists.
- Schools are D-rated, which usually means shorter tenancies and higher turnover. Who's the typical renter profile here, and what's been the actual vacancy rate?
- The area grade is low — what's the realistic commute time and amenity access for the typical tenant pool here? Any planned neighborhood developments (good or bad) we should know about?
- What's the average days-on-market for RENTAL listings here right now (not sales)? A rising rental-DOM trend means longer vacancies and softer asking-rent achievability than the comps imply.
- What's the recent tenant-quality profile in this submarket — average credit score on applications, eviction rate, late-payment / NSF rate, and stable-employment percentage? A property-management company in the area should have these aggregated.
- How much new for-sale + rental construction is in the pipeline within 1–3 miles? Heavy new supply typically softens prices + rents 12–24 months out; constrained supply supports both.
CashFlowRE · CFR-SCZ15P16XY1XMN
· Data 2 days ago
cashflowre.app · 2026-05-29