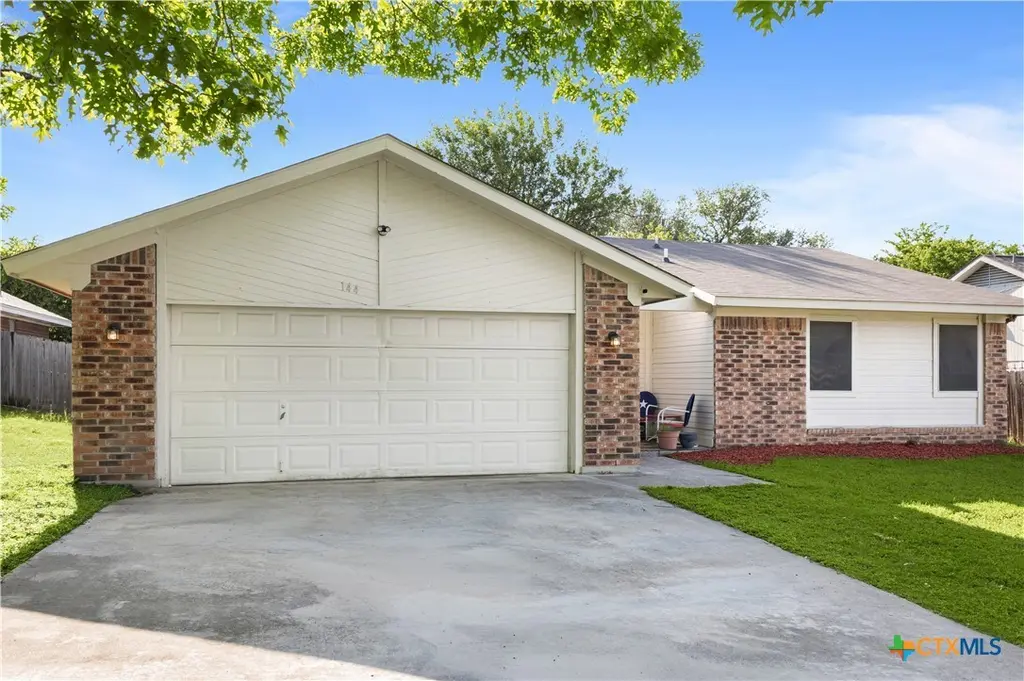
144 Jordan Loop · Nolanville, TX
Flood risk 1/10 · Minimal
- FEMA flood zone
- X (unshaded)
- Chance of flooding over 30 yrs
- 0.0%
- Est. flood insurance / yr
- $507 – $1,088
Fire risk 4/10 · Minor
- Est. fire insurance / yr
- $1,222 – $2,270
Heat risk 8/10 · Major
- Hot days now (above 107°F)
- 7 days/yr
- Hot days in 30 yrs
- 25 days/yr
Wind risk 6/10 · Moderate
- Chance of severe wind over 30 yrs
- 62.0%
Air-quality risk 2/10 · Minimal
- Unhealthy air days now
- 0 days/yr
- Unhealthy air days in 30 yrs
- 1 days/yr
Risk factors via First Street. Map © Google.
Why this score? — see what drove the D grade
The composite is a weighted blend of 9 inputs, each scored 0–100. Each bar is that input's sub-score; the figure is the points it added to the 100-point composite (weight × sub-score).
- ARV discount +14.3/15.0
- Cash flow +6.7/30.0
- Appreciation +5.0/10.0
- Livability +3.7/5.0
- Schools +3.0/10.0
- Rent growth +2.5/5.0
- Condition / age +2.5/5.0
- 1% rule +2.0/10.0
- DSCR +0.9/10.0
$207,000
🖨 Deal sheet 📄 Offer letter ✓ Due diligence
Listing remarks
Welcome home to this charming 3-bedroom, 2-bath home in desirable Nolanville! Featuring a spacious kitchen and dining combination perfect for everyday living and entertaining, this home offers a warm and inviting living room complete with a cozy fireplace and beautiful skylights that fill the space with natural light. Enjoy added energy efficiency with solar screens and relax outdoors in the large backyard with a covered patio—ideal for gatherings, pets, or simply unwinding after a long day.
Key facts
- Spacious kitchen
- Large backyard
- Covered patio
Tags
Property features AI
Exterior
- Parking: 2-car garage
- Utilities: Electricity available; Public water; Public sewer; Public trash collection
- Home design: Single-story home; Resale property
- Construction: Brick construction; Composition / shingle roof; Slab foundation; Built (year source: assessor)
- Exterior features: Covered patio; Covered porch/patio; Wood fence in back yard; City lot, less than quarter acre
Interior
- Kitchen: Dishwasher; Electric range / range; Some electric appliances
- Bedrooms: Bedroom on main level
- Flooring: Carpet; Combination flooring
- Bathrooms: 2 full bathrooms
- Heating & cooling: Has heating; One cooling unit
- Interior features: Ceiling fans; Skylights / skylight(s); Laminate countertops; Pull-down attic stairs; Kitchen/dining combo; Walk-in closet(s); All bedrooms on main level
- Laundry & utility: Inside laundry with electric dryer hookup
Neighborhood map
What this means for you Summary
Snapshot
- This is a 3-bed/2.0-bath single-family listed at $207k.
Deal economics
- At list price, monthly cash flow is $-334 ($-4k/yr) — negative.
- To cash-flow at today's rent, offer at most $148k (28.5% below list).
- To meet the 1% rule (rent ≥ 1% of price), the offer needs to be $144k (30.3% below list).
- Recommended offer: $144k (30.3% below list) — sets the bar for 1% rule.
- Cap rate 4.4% vs local median 3.4% in Nolanville — meaningfully above typical; check what's discounted (condition, days-on-market, listing class) to confirm the premium yield is real.
Location & tenants
- Location reads 74/100 on livability (#176 in TX, #4,655 nationally) — a middle-class / working-renter tenant base. Strengths: crime A+, cost of living A+, housing A+; Watch: schools D+, amenities F, commute F.
- Killeen ISD (urban): math 31% / reading 38% proficiency, ranked #524 of 826 in TX (top 63%) — families likely to look elsewhere, expect single-tenant / working-renter base with shorter leases.
- Market conditions: 235 active listings in the ZIP; 40 comparable units currently listed for rent nearby; rentals lingering (median 44d on market — plan ~5-8 weeks vacancy on turnover, expect pricing pressure); 52% of comp listings sitting > 30 days — soft ceiling on asking rent; 3,222 units permitted in Bell County in 2024 (246 in 5+ unit buildings).
Forward outlook
- In year one you build about $2k of equity ($1k loan paydown + $77 appreciation (0.0% local appreciation)).
- Bell County population projected at +21% by 2050 — long-run rental-demand tailwind backs the buy-and-hold thesis.
Negotiation context
- It's been on market 37 days — a 3% lower offer ($201k) is reasonable based on typical stale-listing flexibility.
- 9 sale attempts since 21y ago with the ask held roughly flat each time — persistent listings suggest the price (not the market) is what's stuck; bring a comps-based counter.
- Current owner paid $88k; list at $207k implies a 137% gain — meaningful room to come down on a strong offer.
Risks & watch-outs
- Climate carrying-cost: major wind risk, 62% chance of damaging wind over 30y; extreme-heat days projected 7→25/yr by 2055 (HVAC capex compounding) — expect insurance premiums to compound above CPI over the hold.
Questions for the listing agent
- What do current leases actually rent for vs. the listed asking? Can we see a recent rent roll and the last 12 months of T-12 income?
- It's been on market 37 days. Have you received any prior offers? Is the seller open to a 30% concession, seller financing, or rate buy-down credit?
- Is there a deadline driving the sale (1031 exchange, divorce, estate, relocation)? That informs how much negotiation room exists.
- Schools are D-rated, which usually means shorter tenancies and higher turnover. Who's the typical renter profile here, and what's been the actual vacancy rate?
- The area grade is low — what's the realistic commute time and amenity access for the typical tenant pool here? Any planned neighborhood developments (good or bad) we should know about?
- What's the average days-on-market for RENTAL listings here right now (not sales)? A rising rental-DOM trend means longer vacancies and softer asking-rent achievability than the comps imply.
- What's the recent tenant-quality profile in this submarket — average credit score on applications, eviction rate, late-payment / NSF rate, and stable-employment percentage? A property-management company in the area should have these aggregated.
- How much new for-sale + rental construction is in the pipeline within 1–3 miles? Heavy new supply typically softens prices + rents 12–24 months out; constrained supply supports both.
Investment metrics
- 1% rule
- 0.70% ✗
- Cap rate
- 4.36%
- Cash-on-cash
- -6.91%
- DSCR
- 0.69
- GRM
- 12.0
CMA / ARV
- ARV (median comp)
- $243,889
- List price
- $207,000
- Delta
- -15.13%
- Verdict
- UNDERPRICED
- Comps
- 20 within 1.0 mi
Show comp detail 2 sales within ~0.75 mi
| Address | Dist | Beds/Ba | Sqft | Sold | Price | $/sf | Match |
|---|---|---|---|---|---|---|---|
| 1406 Ashley Dr | 0.07mi | 3/2.0 | 1,317 (+4%) | 6mo | $216,000 | $164 | 85 |
| 127 Jordan Loop | 0.07mi | 3/2.0 | 1,128 (-11%) | 3mo | $184,999 | $164 | 76 |
Match score weights: distance 35% · size 25% · config 20% · recency 20%. Top-matched comps best support the ARV.
Projected returns pro-forma
0.04% appreciation · 3.0% rent growth · sell at horizon
- IRR
- -9.9%
- Equity multiple
- 0.54×
- Total profit
- $-26,909
- Equity at exit
- $60,491
- IRR
- -3.7%
- Equity multiple
- 0.60×
- Total profit
- $-23,051
- Equity at exit
- $73,020
Cash invested: $57,960 (down + closing). Projections, not guarantees.
Landlord ↔ Tenant lean methodology
- Overall (STATE)
- 87 Strongly Landlord-Friendly
- State Texas
- 87 Strongly Landlord-Friendly · R+5
- County
- — inherits STATE
- City
- — inherits STATE
ZIP-level market 76559
- Home prices YoY
- 0.0%
- Active inventory
- 235
- Price-to-rent
- 12.0×
Monthly cashflow live
- Estimated rent
- $1,443 high interval (Pro) →
- Mortgage (P&I)
- −$1,086
- Tax from tax record
- −$302 /mo · $3,620/yr
- Insurance
- −$86
- HOA
- −$0
- Vacancy / Maint / Mgmt
- −$303
- Net cashflow
- $-334
Break-even live
UW: 25.0% down · 7.5% · 30yr · 1.5% tax · 5.0% vac · 8.0% maint · 8.0% mgmt
Financing live
Cash to close
- Down payment
- $51,750
- Closing costs
- $6,210
- Reserves months
- —
- Total cash needed
- —
Loan-product check · same deal, 3 products live
Conventional
25% down · 7.5% · 30yr
- Down + closing
- —
- Monthly P&I
- —
- Monthly cashflow
- —
- DSCR
- —
- Eligible?
- —
Personal DTI + credit; lowest rate.
DSCR
20% down · 8.5% · 30yr
- Down + closing
- —
- Monthly P&I
- —
- Monthly cashflow
- —
- DSCR
- —
- Eligible?
- —
No personal income docs; deal must DSCR.
Hard money
10% down · 12.0% · 12mo
- Down + closing
- —
- Monthly P&I
- —
- Monthly cashflow
- —
- DSCR
- —
- Eligible?
- —
Short-term bridge; refi at stabilization.
Rent comps 40 comps
| Address | Beds | Baths | Sqft | Rent | $/sqft | DOM | Units | Dist |
|---|---|---|---|---|---|---|---|---|
| 1602 Old Nolanville Rd Unit B Nolanville, TX | 3.0 | 2.0 | 1276 | $1,350 | $1.06 | 23d | 1 | 0.05mi |
| 1805 Diana Ln Harker Heights, TX | 4.0 | 2.0 | 1732 | $1,595 | $0.92 | 43d | 1 | 0.22mi |
| 707 End O Trl Harker Heights, TX | 3.0 | 2.0 | 1508 | $1,850 | $1.23 | 13d | 1 | 0.28mi |
| 406 Diana Ln Harker Heights, TX | 4.0 | 2.0 | 1617 | $1,600 | $0.99 | 43d | 1 | 0.29mi |
| 406 Stonewall Rdg Harker Heights, TX | 3.0 | 2.0 | 1670 | $1,995 | $1.19 | 43d | 1 | 0.50mi |
| 1605 Cedar Oaks Ln Harker Heights, TX | 4.0 | 2.0 | 1750 | $1,850 | $1.06 | 43d | 1 | 0.56mi |
| 1623 Yuma Trl Unit A Harker Heights, TX | 3.0 | 2.0 | 1152 | $1,300 | $1.13 | 23d | 1 | 0.89mi |
| 1623 Yuma Trl Unit A Harker Heights, TX | 3.0 | 2.0 | 1152 | $1,350 | $1.17 | 43d | 1 | 0.89mi |
| 124 Wind Ridge Dr Unit B Harker Heights, TX | 2.0 | 1.0 | 1012 | $1,175 | $1.16 | 43d | 1 | 0.91mi |
| 1606 Yuma Trl Unit A Harker Heights, TX | 3.0 | 2.0 | 1152 | $1,250 | $1.09 | 23d | 1 | 0.93mi |
| 1301 Indian Trl Harker Heights, TX | 2.0 | 2.0 | 976 | $850 | $0.87 | 43d | 1 | 0.93mi |
| 1301 Indian Trl Unit D Harker Heights, TX | 2.0 | 1.5 | 976 | $795 | $0.81 | 43d | 1 | 0.93mi |
| 1513 Indian Trl Unit A Harker Heights, TX | 2.0 | 1.0 | 952 | $995 | $1.05 | 13d | 1 | 0.94mi |
| 1909 Caspian Trl Unit B Harker Heights, TX | 3.0 | 2.0 | 1367 | $1,495 | $1.09 | 43d | 1 | 0.95mi |
| 1619 Pima Trl Unit B Harker Heights, TX | 3.0 | 2.0 | 1150 | $1,295 | $1.13 | 23d | 1 | 0.96mi |
| 701 E Central Texas Expy Harker Heights, TX | 1.0–2.0 | 1.0–2.0 | 701 | $1,195 | $1.70 | 13d | 56 | 1.00mi |
| 1610 Pima Trl Unit A Harker Heights, TX | 3.0 | 2.0 | 1252 | $1,700 | $1.36 | 43d | 1 | 1.01mi |
| 1004 Indian Trl Apt D Harker Heights, TX | 2.0 | 2.0 | 1200 | $900 | $0.75 | 43d | 1 | 1.01mi |
| 1622 Pima Trl Unit A Harker Heights, TX | 3.0 | 2.0 | 1252 | $1,350 | $1.08 | 13d | 1 | 1.03mi |
| 1618 Pima Trl Unit A-SHOWABLE Harker Heights, TX | 3.0 | 2.0 | 1370 | $1,395 | $1.02 | 23d | 1 | 1.03mi |
| 1814 Horatio St Nolanville, TX | 3.0 | 2.0 | 1841 | $2,065 | $1.12 | 43d | 1 | 1.04mi |
| 2053 Stillwell St Nolanville, TX | 4.0 | 2.0 | 1811 | $2,300 | $1.27 | 23d | 1 | 1.04mi |
| 1514 Dakota Trce Apt A Harker Heights, TX | 3.0 | 2.0 | 1330 | $1,395 | $1.05 | 23d | 1 | 1.05mi |
| 1608 Aztec Trce Apt A Harker Heights, TX | 3.0 | 2.0 | 1151 | $1,000 | $0.87 | 43d | 1 | 1.06mi |
| 910 Frontier Trl Harker Heights, TX | 4.0 | 2.0 | 1469 | $1,595 | $1.09 | 23d | 1 | 1.12mi |
| 2012 Stillwell St Nolanville, TX | 4.0 | 3.0 | 1800 | $2,195 | $1.22 | 23d | 1 | 1.13mi |
| 1409 Natchez Trl Harker Heights, TX | 3.0 | 2.0 | 1347 | $1,350 | $1.00 | 43d | 1 | 1.13mi |
| 201 Lookout Ridge Blvd Apt 321 Harker Heights, TX | 2.0 | 2.0 | 900 | $1,095 | $1.22 | 43d | 1 | 1.14mi |
| 201 Lookout Ridge Blvd Apt 223 Harker Heights, TX | 2.0 | 2.0 | 900 | $1,170 | $1.30 | 43d | 1 | 1.14mi |
| 201 Lookout Ridge Blvd Unit 224 Harker Heights, TX | 2.0 | 2.0 | 900 | $1,095 | $1.22 | 23d | 1 | 1.14mi |
| 201 Lookout Ridge Blvd Apt 320 Harker Heights, TX | 2.0 | 2.0 | 900 | $1,045 | $1.16 | 43d | 1 | 1.15mi |
| 201 Lookout Ridge Blvd Apt 120 Harker Heights, TX | 2.0 | 2.0 | 900 | $1,145 | $1.27 | 43d | 1 | 1.16mi |
| 1427 Hopi Trl Unit B Harker Heights, TX | 3.0 | 2.0 | 1400 | $1,245 | $0.89 | 13d | 1 | 1.17mi |
| 1701 Dakota Trce Harker Heights, TX | 3.0 | 2.5 | 1219 | $1,650 | $1.35 | 21d | 1 | 1.18mi |
| 1610 Tejas Trl Apt B Harker Heights, TX | 2.0 | 2.0 | 1217 | $1,350 | $1.11 | 23d | 1 | 1.18mi |
| 1610 Tejas Trl Apt B Harker Heights, TX | 2.0 | 2.0 | 1217 | $1,350 | $1.11 | 43d | 1 | 1.18mi |
| 809 Beaver Trl Harker Heights, TX | 3.0 | 2.0 | 1385 | $1,495 | $1.08 | 23d | 1 | 1.19mi |
| 1613 Pontotoc Trce Apt B Harker Heights, TX | 3.0 | 2.0 | 1310 | $1,395 | $1.06 | 43d | 1 | 1.21mi |
| 1728 Tejas Trl Harker Heights, TX | 3.0 | 2.0–2.5 | 1293 | $1,832 | $1.42 | 13d | 13 | 1.21mi |
| 1621 Pontotoc Trce Harker Heights, TX | 2.0 | 2.0 | 932 | $1,195 | $1.28 | 43d | 1 | 1.21mi |
Listing history 40 events
-
2026-06-18days on market $207,000 Active 37 DOM
-
2026-06-17days on market $207,000 Active 36 DOM
-
2026-06-16days on market $207,000 Active 35 DOM
-
2026-06-15days on market $207,000 Active 34 DOM
-
2026-06-14days on market $207,000 Active 32 DOM
-
2026-06-13days on market $207,000 Active 31 DOM
-
2026-06-10days on market $207,000 Active 29 DOM
-
2026-06-09days on market $207,000 Active 28 DOM
-
2026-06-08days on market $207,000 Active 27 DOM
-
2026-06-07days on market $207,000 Active 26 DOM
-
2026-06-03days on market $207,000 Active 22 DOM
-
2026-06-02days on market $207,000 Active 21 DOM
-
2026-06-01days on market $207,000 Active 20 DOM
-
2026-05-31days on market $207,000 Active 19 DOM
-
2026-05-30days on market $207,000 Active 18 DOM
-
2026-05-12$207,000 Active 502-char remark
-
2021-11-03soldstatus
-
2021-11-02soldstatus
-
2021-09-03status Pending
-
2021-08-30price $160,000
-
2021-08-26status Active
-
2021-08-26price $170,000
-
2021-08-21status Pending
-
2021-08-13status Active
-
2021-08-13price $175,000
-
2021-07-10status Pending
-
2021-07-07$160,000 Active
-
2019-12-11soldstatus
-
2019-10-11status Pending
-
2019-09-17$120,259 Active
-
2009-10-01historical
-
2009-07-14soldstatus
-
2009-04-07$99,500
-
2009-04-07$99,500
-
2007-11-02soldstatus
-
2006-06-19soldstatus $87,500
-
2006-03-01$87,500
-
2005-12-13historical
-
2005-10-10$90,000
-
1993-12-16soldstatus
ⓘ Source: listings_history table (triggers on properties + properties_extension) + one-shot
backfill from property_details.listing_events for pre-trigger history.
Tax reassessment forecast TX · Resets to sale price
- Current annual tax
- $3,620 · $302/mo
- Projected year-2 tax
- $3,788 · $316/mo
- Expected delta
- +$168/yr (+$14/mo · 4.6%)
ⓘ Screening estimate from a state-policy table — verify with the county assessor before closing.
Climate risk First Street
- Flood 1/10 Low FEMA zone X (unshaded) · 0% chance over 30 yrs
- Wildfire 4/10 Moderate
- Heat 8/10 Severe 7 d/yr ≥107°F today · 25 d/yr by 30 yrs out
- Wind 6/10 Major 62% chance of damaging wind over 30 yrs
- Air quality 2/10 Low 0 unhealthy d/yr today · 1 by 30 yrs out
Nearby sold comps map
Loading sold comps map…
Walkable amenities ~0.75 mi
Loading nearby amenities…
Taxation est. · year 1
- Rental income
- $17,311
- − Mortgage interest
- −$11,595
- − Property taxes
- −$3,620
- − Insurance
- −$1,035
- − Repairs & maintenance
- −$1,385
- − Management
- −$1,385
- − Depreciation
- −$6,022
- Taxable loss
- −$7,731
- Est. tax savings @ 24.0%
- +$1,856
- After-tax cash flow
- $-2,151/yr
For passive investors: Depreciation is non-cash, so a rental often shows a tax loss while cash-flowing — sheltering income. Rental losses are passive: they offset passive income freely, and up to $25,000/yr can offset ordinary (W-2) income if you actively participate and your MAGI is under $100k (phasing out to $0 by $150k); unused losses carry forward. On sale, claimed depreciation is recaptured at up to 25%, and gains may owe capital-gains tax (a 1031 exchange can defer both). Figures are a year-1 estimate at your 24.0% rate — not tax advice; consult a CPA.
Schools (NCES district)
- District
- Killeen ISD
- NCES district ID
- 4825660
- Math proficiency
- 31% ▼ -16.00%
- Reading proficiency
- 38% ▼ -3.00%
- Median HH income
- $47,665
- Composite
- 29.69/100
- National rank
- #6458
- State rank
- #524 of 826 in TX
Livability — Nolanville
- Score
- 74/100
- State rank
- #176
- US rank
- #4655
Category grades
Schools grade is shown separately in the Schools card above.
Census & demographics
- Census place
- Nolanville, TX
- City population
- 6,896
- Population (ZIP)
- 6,896
Population outlook (Bell County) Hauer SSP2
- Today (2025)
- 371,114 people
- By 2030
- 389,104 · +4.8%
- By 2040
- 420,592 · +13.3%
- By 2050
- 447,779 · +20.7%
- By 2075
- 499,130 · +34.5%
- By 2100
- 505,680 · +36.3%
Race, ethnicity, and origin ACS 2023
- Neighborhood character
- Diverse neighborhood (Simpson 0.65)
- Race & ethnicity
- White 52% Hispanic / Latino 20% Black 20% Two or more races 6% Asian 5% Pacific Islander 2%
- Hispanic origin (detail)
- Mexican 16% Puerto Rican 1%
- Common ancestry
- Italian 2% Lithuanian 1% Danish 1%
- Foreign-born
- 8% · Canada, Vietnam, South Korea
- Languages at home
- 88% English-only · Spanish 9% Other Indo-European 1% Korean 1%
Political lean MEDSL · Bell
- 2024 margin
- R (+16.2) · D 41.3% · R 57.6% · Other 1.1%
- 2008→2024 swing
- -6.5pp toward R · 2008: -9.8pp · 2024: -16.2pp
- All cycles
- 2024: R+16.2 2020: R+8.5 2016: R+15.1 2012: R+16.4 2008: R+9.8
Not yet ingested
- Civics
- —
Market trends
- HPI YoY
- ▬ 0.04%
- Current HPI
- 170.1375
- Rent YoY
- —
- Metro
- —
- State GDP YoY
- ▲ 3.95%
- F500 in state
- 110
Industry mix (Fortune 500 HQ in TX)
| Industry | F500 HQs | Revenue |
|---|---|---|
| Energy | 16 | $1,198B |
|
||
| Technology | 5 | $198B |
|
||
| Engineering / Construction | 4 | $72B |
|
||
| Energy Services | 3 | $60B |
|
||
| Utilities | 3 | $41B |
|
||
| Healthcare | 2 | $330B |
|
||
Price history
+130.0% since first listed25 events — show timeline
- 2026-05-12 Listed $207,000 CTXMLS
- 2021-11-03 Sold (Public Records) — Public Records
- 2021-11-02 Sold (Public Records) — Public Records
- 2021-09-03 Pending — CTXMLS
- 2021-08-30 Price Changed $160,000 CTXMLS
- 2021-08-26 Relisted — CTXMLS
- 2021-08-26 Price Changed $170,000 CTXMLS
- 2021-08-21 Pending — CTXMLS
- 2021-08-13 Relisted — CTXMLS
- 2021-08-13 Price Changed $175,000 CTXMLS
- 2021-07-10 Pending — CTXMLS
- 2021-07-07 Listed $160,000 CTXMLS
- 2019-12-11 Sold (Public Records) — Public Records
- 2019-10-11 Pending — CTXMLS
- 2019-09-17 Listed $120,259 CTXMLS
- 2009-10-01 Listing Removed — CTXMLS
- 2009-07-14 Sold (Public Records) — Public Records
- 2009-04-07 Listed $99,500 CTXMLS
- 2009-04-07 Listed $99,500 CTXMLS
- 2007-11-02 Sold (Public Records) — Public Records
- 2006-06-19 Sold (MLS) $87,500 CTXMLS
- 2006-03-01 Listed $87,500 CTXMLS
- 2005-12-13 Listing Removed — CTXMLS
- 2005-10-10 Listed $90,000 CTXMLS
- 1993-12-16 Sold (Public Records) — Public Records
Property tax history
+5.4%/yrLatest (2026): $3,620 · +2.9% YoY. Source: county tax records.
Cash-flow waterfall
monthlySold comps — $/sqft
last 12 mo · ≤1 miLoading sold comps…