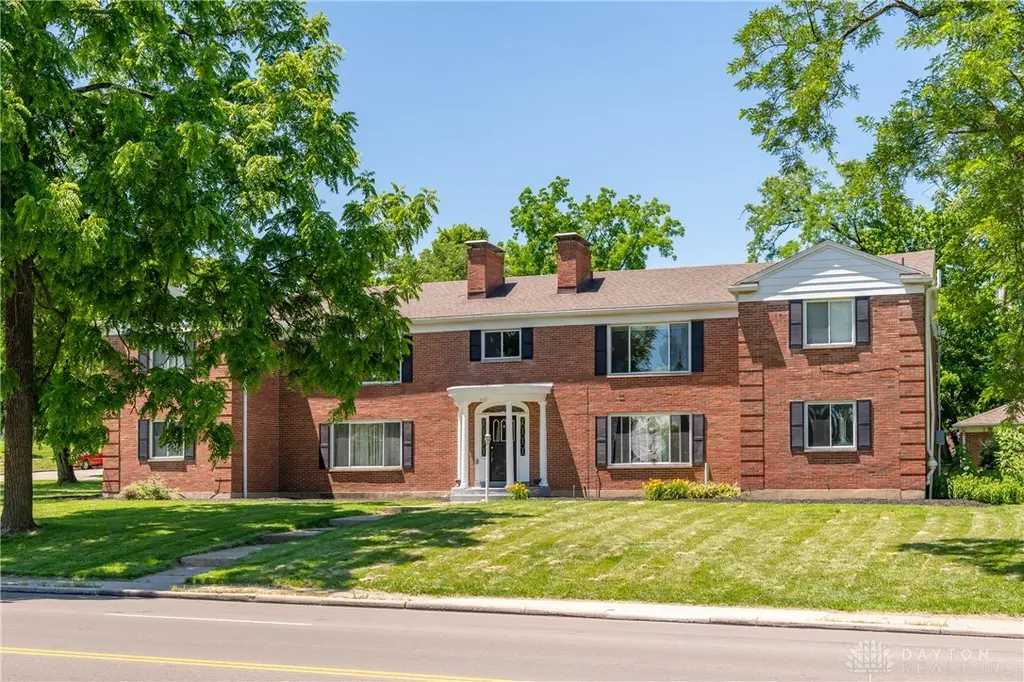
1121 Far Hills Ave
Oakwood, OH 45419
$749,900D+
8 bd · 1.5 ba ·
8,340 sqft ·
Built 1952
· MultiFamily
· Active
· 14 DOM
Cashflow @ list (25.0% down · 7.5%)
Estimated rent
$9,010/mo
Mortgage (P&I)
−$3,933
Tax + insurance
−$2,186
HOA
−$0
Vac / Maint / Mgmt
−$1,892
Net cashflow
$1,000/mo
Annual
$11,998/yr
Cap rate
7.89%
Cash-on-cash
5.71%
DSCR
1.25
1% rule
1.20%
Cash to close
$209,972
Investor read
- This is a 4 × 2-bed/1.0-bath units multifamily listed at $750k.
- At list price, monthly cash flow is $1k ($12k/yr) — positive. Per door: $250/mo.
- The deal already cash-flows at list — no discount required.
- Meets the 1% rule at list price ($9k rent vs $750k).
- Only 14 days on market — expect competitive offers; lowballing is unlikely to land.
- Local home prices are declining (-3.0%/yr); year-one equity from $5k of loan paydown is wiped out by about $22k of value loss. Plan a longer hold.
- Location reads: area grade D — affects rentability + tenant quality, not the cash-flow math above.
- Oakwood City (suburban): math 88% / reading 88% proficiency, ranked #7 of 656 in OH (top 1%) — strong family-tenant draw, lease renewals of 3-5y typical; only 7% free/reduced lunch — higher-income household profile.
- Watch-outs: property tax is 3.0% of price; built in 1952 — expect roof / HVAC / electrical / plumbing capex.
- Market conditions: Rents flat; 90 active listings in the ZIP; solid renter incomes; 907 units permitted in Montgomery County in 2024 (416 in 5+ unit buildings).
- Montgomery County population projected at -10% by 2050 — secular population decline; favor cash flow + early exit over multi-decade hold.
- 7 sale attempts since 19y ago with the ask held roughly flat each time — persistent listings suggest the price (not the market) is what's stuck; bring a comps-based counter.
- Current owner paid $522k; 44% above their basis — modest negotiation headroom, anchor on the comps not their cost.
- Cap rate 7.9% vs local median 1.9% in Oakwood — top-decile yield for the area; either an underpriced asset or a hidden risk that comps aren't pricing in. Stress-test before assuming the spread holds.
- At $9,010/mo this rent would consume 117% of the median local household income ($92k/yr) (locally 359% of renters already pay >50% of income on rent) — very limited rent-growth headroom before tenants either downsize or default.
Questions for listing agent
- Can we see the unit-by-unit rent roll, current vacancy, and any below-market leases? What's the average tenancy length?
- What capital expenditures (roof, boiler, parking lot, exteriors) have been made in the last 5 years, and what's planned in the next 2?
- Built in 1952 — when were the roof, HVAC, electrical panel, plumbing, and water heater last replaced?
- Property tax is high relative to price — has the assessment been appealed recently, and will the sale trigger a re-assessment?
- Is there a deadline driving the sale (1031 exchange, divorce, estate, relocation)? That informs how much negotiation room exists.
- The area grade is low — what's the realistic commute time and amenity access for the typical tenant pool here? Any planned neighborhood developments (good or bad) we should know about?
- What's the average days-on-market for RENTAL listings here right now (not sales)? A rising rental-DOM trend means longer vacancies and softer asking-rent achievability than the comps imply.
- What's the recent tenant-quality profile in this submarket — average credit score on applications, eviction rate, late-payment / NSF rate, and stable-employment percentage? A property-management company in the area should have these aggregated.
CashFlowRE · CFR-SEMTNFBT16659Z
· Data 2 days ago
cashflowre.app · 2026-05-29