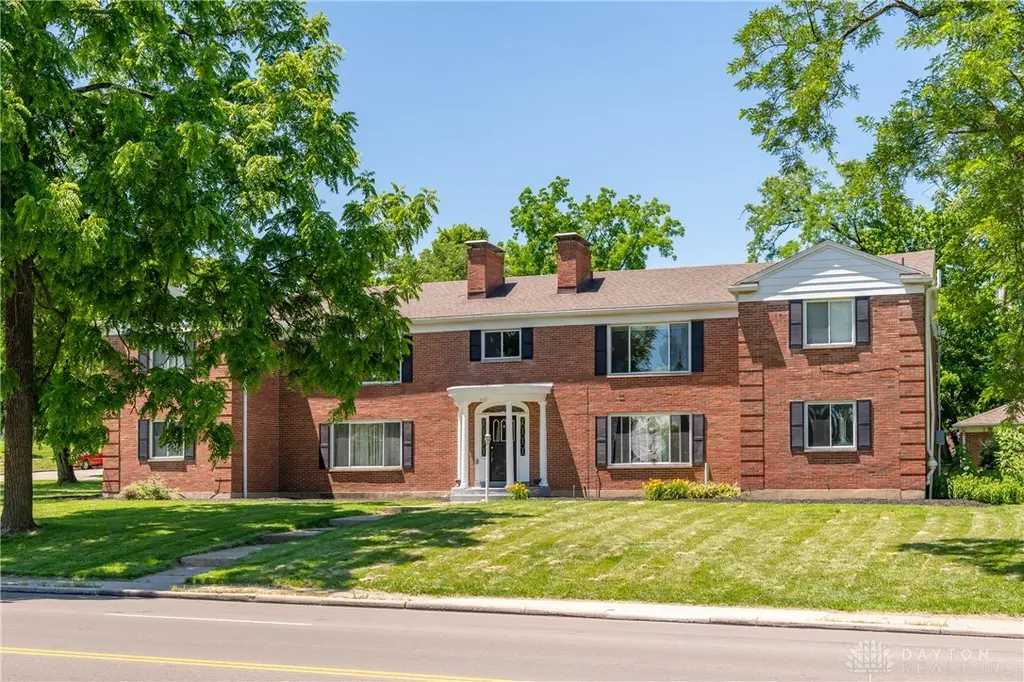
 Fourplex
1121 Far Hills Ave · Oakwood, OH
Flood risk 1/10 · Minimal
- FEMA flood zone
- X (unshaded)
- Chance of flooding over 30 yrs
- 0.0%
- Est. flood insurance / yr
- $473 – $860
Fire risk 1/10 · Minimal
- Est. fire insurance / yr
- $713 – $1,323
Heat risk 3/10 · Minor
- Hot days now (above 100°F)
- 7 days/yr
- Hot days in 30 yrs
- 16 days/yr
Wind risk 2/10 · Minimal
- Chance of severe wind over 30 yrs
- 1.0%
Air-quality risk 3/10 · Minor
- Unhealthy air days now
- 3 days/yr
- Unhealthy air days in 30 yrs
- 5 days/yr
Risk factors via First Street. Map © Google.
Why this score? — see what drove the D+ grade
The composite is a weighted blend of 9 inputs, each scored 0–100. Each bar is that input's sub-score; the figure is the points it added to the 100-point composite (weight × sub-score).
- Cash flow +20.6/30.0
- Schools +7.8/10.0
- 1% rule +7.0/10.0
- DSCR +6.5/10.0
- Rent growth +2.6/5.0
- Livability +2.5/5.0
- Condition / age +2.5/5.0
- ARV discount +0.0/15.0
- Appreciation +0.0/10.0
$749,900
🖨 Deal sheet 📄 Offer letter ✓ Due diligence
Multi-family units
County records classify this as Multi-Family (5+ Unit). Listing-text estimate: 4 units. estimate disagrees with records
5+ unit building — per-unit beds/baths from public records are typically unavailable; the breakdown below (if shown) is an estimate from the listing text.
Listing remarks MLS
What better words to describe your new investment - Oakwood Schools, Brick building, huge units, and separate garage! Each unit is over 1,200 SF including 2 spacious bedrooms and 1 bathroom plus tons of closet space. This classic two-story brick building has front & rear security doors, a full basement for storage, and your own washer/dryer hook-up plus one garage for each unit. Each unit has been updated with new carpeting, paint, fixtures, and appliances. Schedule your tour today!
Key facts
- All brick building
- Updated windows
- 4 unit building
Tags
Property features AI
Finance
- Financial info: Gross income: $71,940 (multi-family); Property listed for sale
Exterior
- Parking: Garage with 4 spaces; Four or more off-street parking spaces
- Utilities: Natural gas available; Public water; Sewer available; Cable available
- Home design: 2-story building; Brick construction
- Construction: Brick construction
- Exterior features: Residential zoning; Lot dimensions 144 x 147 x 168 x 132; Lot area approximately 0.515 acres
Interior
- Kitchen: Gas water heater
- Bedrooms: Two-bedroom unit type
- Bathrooms: 4 full bathrooms
- Heating & cooling: Central air conditioning; Forced air heating (natural gas)
- Interior features: Full, partially finished basement
- Laundry & utility: Tenant pays electricity and gas
Neighborhood map
What this means for you Summary
Snapshot
- This is a 4 × 2-bed/1.0-bath units multifamily listed at $750k.
Deal economics
- At list price, monthly cash flow is $1k ($12k/yr) — positive. Per door: $250/mo.
- The deal already cash-flows at list — no discount required.
- Meets the 1% rule at list price ($9k rent vs $750k).
- Cap rate 7.9% vs local median 1.9% in Oakwood — top-decile yield for the area; either an underpriced asset or a hidden risk that comps aren't pricing in. Stress-test before assuming the spread holds.
Location & tenants
- Location reads: area grade D — affects rentability + tenant quality, not the cash-flow math above.
- Oakwood City (suburban): math 88% / reading 88% proficiency, ranked #7 of 656 in OH (top 1%) — strong family-tenant draw, lease renewals of 3-5y typical; only 7% free/reduced lunch — higher-income household profile.
- Market conditions: Rents flat; 90 active listings in the ZIP; solid renter incomes; 907 units permitted in Montgomery County in 2024 (416 in 5+ unit buildings).
- At $9,010/mo this rent would consume 117% of the median local household income ($92k/yr) (locally 359% of renters already pay >50% of income on rent) — very limited rent-growth headroom before tenants either downsize or default.
Forward outlook
- Local home prices are declining (-3.0%/yr); year-one equity from $5k of loan paydown is wiped out by about $22k of value loss. Plan a longer hold.
- Montgomery County population projected at -10% by 2050 — secular population decline; favor cash flow + early exit over multi-decade hold.
Negotiation context
- Only 14 days on market — expect competitive offers; lowballing is unlikely to land.
- 7 sale attempts since 19y ago with the ask held roughly flat each time — persistent listings suggest the price (not the market) is what's stuck; bring a comps-based counter.
- Current owner paid $522k; 44% above their basis — modest negotiation headroom, anchor on the comps not their cost.
Risks & watch-outs
- Watch-outs: property tax is 3.0% of price; built in 1952 — expect roof / HVAC / electrical / plumbing capex.
Questions for the listing agent
- Can we see the unit-by-unit rent roll, current vacancy, and any below-market leases? What's the average tenancy length?
- What capital expenditures (roof, boiler, parking lot, exteriors) have been made in the last 5 years, and what's planned in the next 2?
- Built in 1952 — when were the roof, HVAC, electrical panel, plumbing, and water heater last replaced?
- Property tax is high relative to price — has the assessment been appealed recently, and will the sale trigger a re-assessment?
- Is there a deadline driving the sale (1031 exchange, divorce, estate, relocation)? That informs how much negotiation room exists.
- The area grade is low — what's the realistic commute time and amenity access for the typical tenant pool here? Any planned neighborhood developments (good or bad) we should know about?
- What's the average days-on-market for RENTAL listings here right now (not sales)? A rising rental-DOM trend means longer vacancies and softer asking-rent achievability than the comps imply.
- What's the recent tenant-quality profile in this submarket — average credit score on applications, eviction rate, late-payment / NSF rate, and stable-employment percentage? A property-management company in the area should have these aggregated.
- How much new apartment / multifamily construction is in the pipeline within 1–3 miles? Heavy new supply (>2% of stock underway) typically softens rents 12–24 months out; light construction supports rent growth.
Investment metrics
- 1% rule
- 1.20% ✓
- Cap rate
- 7.89%
- Cash-on-cash
- 5.71%
- DSCR
- 1.25
- GRM
- 6.9
CMA / ARV
- ARV (on-the-fly)
- $525,420
- Comps found
- 1
Show comp detail 1 sale within ~0.75 mi
| Address | Dist | Beds/Ba | Sqft | Sold | Price | $/sf | Match |
|---|---|---|---|---|---|---|---|
| 1121 Far Hills Ave | 0.00mi | 8/4.0 | 8,340 (0%) | 20mo | $522,500 | $63 | 73 |
Match score weights: distance 35% · size 25% · config 20% · recency 20%. Top-matched comps best support the ARV.
Projected returns pro-forma
-3.0% appreciation · 0.57% rent growth · sell at horizon
- IRR
- -10.6%
- Equity multiple
- 0.63×
- Total profit
- $-78,635
- Equity at exit
- $111,813
- IRR
- -5.7%
- Equity multiple
- 0.68×
- Total profit
- $-67,652
- Equity at exit
- $64,838
Cash invested: $209,972 (down + closing). Projections, not guarantees.
Landlord ↔ Tenant lean methodology
- Overall (STATE)
- 73 Landlord-Friendly
- State Ohio
- 73 Landlord-Friendly · R+6
- County
- — inherits STATE
- City
- — inherits STATE
ZIP-level market 45419
- Rents YoY
- 0.6%
- Active inventory
- 90
- Price-to-rent
- 27.7×
Monthly cashflow live
- Estimated rent
- $9,010 high interval (Pro) →
- Mortgage (P&I)
- −$3,933
- Tax from tax record
- −$1,873 /mo · $22,477/yr
- Insurance
- −$312
- HOA
- −$0
- Vacancy / Maint / Mgmt
- −$1,892
- Net cashflow
- $1,000
Break-even live
4-unit breakdown (identical units grouped — click to expand)
| Units | Beds | Baths | Est. rent |
|---|---|---|---|
| 4× units | 2 | 1 | $9,012 |
| #1 | 2 | 1 | $2,253 |
| #2 | 2 | 1 | $2,253 |
| #3 | 2 | 1 | $2,253 |
| #4 | 2 | 1 | $2,253 |
| Total (4 units) | $9,010 | ||
UW: 25.0% down · 7.5% · 30yr · 1.5% tax · 5.0% vac · 8.0% maint · 8.0% mgmt
Financing live
Cash to close
- Down payment
- $187,475
- Closing costs
- $22,497
- Reserves months
- —
- Total cash needed
- —
Loan-product check · same deal, 3 products live
Conventional
25% down · 7.5% · 30yr
- Down + closing
- —
- Monthly P&I
- —
- Monthly cashflow
- —
- DSCR
- —
- Eligible?
- —
Personal DTI + credit; lowest rate.
DSCR
20% down · 8.5% · 30yr
- Down + closing
- —
- Monthly P&I
- —
- Monthly cashflow
- —
- DSCR
- —
- Eligible?
- —
No personal income docs; deal must DSCR.
Hard money
10% down · 12.0% · 12mo
- Down + closing
- —
- Monthly P&I
- —
- Monthly cashflow
- —
- DSCR
- —
- Eligible?
- —
Short-term bridge; refi at stabilization.
Listing history 11 events
-
2026-06-18days on market $749,900 Active 14 DOM
-
2026-06-17days on market $749,900 Active 13 DOM
-
2026-06-16days on market $749,900 Active 12 DOM
-
2026-06-15days on market $749,900 Active 11 DOM
-
2026-06-14days on market $749,900 Active 9 DOM
-
2026-06-10days on market $749,900 Active 6 DOM
-
2026-06-09days on market $749,900 Active 5 DOM
-
2026-06-08days on market $749,900 Active 4 DOM
-
2026-06-07days on market $749,900 Active 3 DOM
-
2026-06-05remarks 671-char remark
-
2026-06-05$749,900 Active 1 DOM
ⓘ Source: listings_history table (triggers on properties + properties_extension) + one-shot
backfill from property_details.listing_events for pre-trigger history.
Tax reassessment forecast OH · Partial reset (capped growth)
- Current annual tax
- $22,477 · $1,873/mo
- Projected year-2 tax
- $22,477 · $1,873/mo
- Expected delta
- $0/yr ($0/mo · 0.0%)
ⓘ Screening estimate from a state-policy table — verify with the county assessor before closing.
Climate risk First Street
- Flood 1/10 Low FEMA zone X (unshaded) · 0% chance over 30 yrs
- Wildfire 1/10 Low
- Heat 3/10 Moderate 7 d/yr ≥100°F today · 16 d/yr by 30 yrs out
- Wind 2/10 Low 100% chance of damaging wind over 30 yrs
- Air quality 3/10 Moderate 3 unhealthy d/yr today · 5 by 30 yrs out
Nearby sold comps map
Loading sold comps map…
Walkable amenities ~0.75 mi
Loading nearby amenities…
Taxation est. · year 1
- Rental income
- $108,120
- − Mortgage interest
- −$42,006
- − Property taxes
- −$22,477
- − Insurance
- −$3,750
- − Repairs & maintenance
- −$8,650
- − Management
- −$8,650
- − Depreciation
- −$21,815
- Taxable income
- $773
- Est. tax owed @ 24.0%
- −$186
- After-tax cash flow
- $11,812/yr
For passive investors: Depreciation is non-cash, so a rental often shows a tax loss while cash-flowing — sheltering income. Rental losses are passive: they offset passive income freely, and up to $25,000/yr can offset ordinary (W-2) income if you actively participate and your MAGI is under $100k (phasing out to $0 by $150k); unused losses carry forward. On sale, claimed depreciation is recaptured at up to 25%, and gains may owe capital-gains tax (a 1031 exchange can defer both). Figures are a year-1 estimate at your 24.0% rate — not tax advice; consult a CPA.
Schools (NCES district)
- District
- Oakwood City
- NCES district ID
- 3904458
- Math proficiency
- 88% ▼ -2.00%
- Reading proficiency
- 88% ▼ -2.00%
- Median HH income
- $93,178
- Composite
- 78.43/100
- National rank
- #78
- State rank
- #7 of 656 in OH
Livability — Oakwood
No livability data for this city. (Only ~50 U.S. cities are tracked.)
Census & demographics
- Census place
- Oakwood, OH
- County
- Montgomery County · 459,541 people
- City population
- 32,301
- Metro
- Dayton-Kettering, OH
- Population (ZIP)
- 17,008
- Household income
- $92,264
- Rent vs Own
- Severe rent burden
- 359.0
Population outlook (Montgomery County) Hauer SSP2
- Today (2025)
- 523,241 people
- By 2030
- 514,948 · -1.6%
- By 2040
- 493,378 · -5.7%
- By 2050
- 469,639 · -10.2%
- By 2075
- 418,360 · -20.0%
- By 2100
- 353,315 · -32.5%
Race, ethnicity, and origin ACS 2023
- Neighborhood character
- Predominantly White (87%)
- Race & ethnicity
- White 87% Two or more races 8% Hispanic / Latino 2% Asian 2% Black 2%
- Common ancestry
- Slovak 4% Romanian 4% Lithuanian 3%
- Foreign-born
- 4% · China, Canada
- Languages at home
- 95% English-only · Tagalog/Filipino 1% Other Indo-European 1% Chinese 1%
Political lean MEDSL · Montgomery
- 2024 margin
- Toss-up / Even · D 49.8% · R 49.3%
- 2008→2024 swing
- -5.8pp toward R · 2008: 6.2pp · 2024: 0.5pp
- All cycles
- 2024: D+0.5 2020: D+2.2 2016: R+1.2 2012: D+3.1 2008: D+6.2
Not yet ingested
- Civics
- —
Market trends
- HPI YoY
- ▼ -259.40%
- Current HPI
- 246.866
- Rent YoY
- ▲ 0.57%
- Metro
- Dayton-Kettering, OH
- State GDP YoY
- ▲ 1.98%
- F500 in state
- 48
Industry mix (Fortune 500 HQ in OH)
| Industry | F500 HQs | Revenue |
|---|---|---|
| Insurance | 3 | $145B |
|
||
| Industrial Machinery | 3 | $49B |
|
||
| Financial Services | 3 | $24B |
|
||
| Consumer Goods | 2 | $93B |
|
||
| Aerospace / Defense | 2 | $47B |
|
||
| Utilities | 2 | $33B |
|
||
Price history
+200.0% since first listed23 events — show timeline
- 2026-06-04 Listed $749,900 Dayton MLS
- 2025-05-13 Rental Removed $1,450 DAYTONMLS
- 2025-04-29 Price Changed $1,450 DAYTONMLS
- 2025-04-18 Listed for Rent $1,590 DAYTONMLS
- 2024-11-01 Sold (Public Records) $522,500 Public Records
- 2024-10-25 Sold (MLS) $522,500 Dayton MLS
- 2024-10-25 Sold (MLS) $522,500 Dayton MLS
- 2024-10-01 Pending — Dayton MLS
- 2024-10-01 Listed $539,900 Dayton MLS
- 2024-01-31 Rental Removed $1,300 DAYTONMLS
- 2023-12-12 Listed for Rent $1,300 DAYTONMLS
- 2017-04-24 Sold (Public Records) $344,000 Public Records
- 2017-02-24 Sold (MLS) $344,000 Dayton MLS
- 2017-02-24 Sold (MLS) $344,000 Dayton MLS
- 2017-01-27 Pending — Dayton MLS
- 2016-12-21 Relisted — Dayton MLS
- 2016-10-24 Contingent — Dayton MLS
- 2016-10-19 Listed $369,613 Dayton MLS
- 2011-01-25 Sold (MLS) $260,150 Dayton MLS
- 2011-01-25 Sold (MLS) $260,150 Dayton MLS
- 2010-12-27 Listing Removed — Dayton MLS
- 2007-07-27 Listed $264,900 Dayton MLS
- 2001-03-20 Sold (Public Records) $250,000 Public Records
Property tax history
+7.1%/yrLatest (2025): $22,477 · +3.7% YoY. Source: county tax records.
Cash-flow waterfall
monthlySold comps — $/sqft
last 12 mo · ≤1 miLoading sold comps…