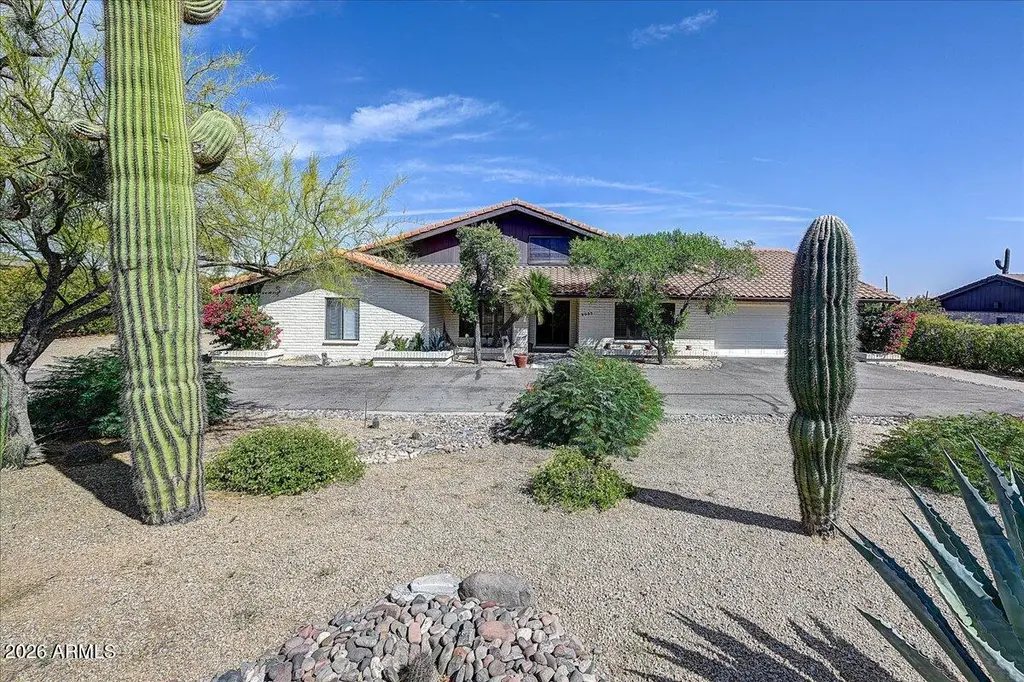
9033 E Lazywood Pl
Carefree, AZ 85377
$965,000B-
3 bd · 3.0 ba ·
2,981 sqft ·
Built 1979
· SingleFamily
· Active
· 23 DOM
Cashflow @ list (25.0% down · 7.5%)
Estimated rent
$8,680/mo
Mortgage (P&I)
−$5,061
Tax + insurance
−$571
HOA
−$5
Vac / Maint / Mgmt
−$1,823
Net cashflow
$1,220/mo
Annual
$14,638/yr
Cap rate
7.81%
Cash-on-cash
5.42%
DSCR
1.24
1% rule
0.90%
Cash to close
$270,200
Investor read
- This is a 3-bed/3.0-bath single-family listed at $965k.
- At list price, monthly cash flow is $1k ($15k/yr) — positive.
- The deal already cash-flows at list — no discount required.
- To meet the 1% rule (rent ≥ 1% of price), the offer needs to be $868k (10.1% below list).
- It's been on market 23 days — a 2% lower offer ($951k) is reasonable based on typical stale-listing flexibility.
- Recommended offer: $868k (10.1% below list) — sets the bar for 1% rule.
- In year one you build about $66k of equity ($7k loan paydown + $59k appreciation (6.1% local appreciation)).
- Location reads 68/100 on livability (#58 in AZ) — a middle-class / working-renter tenant base. Strengths: crime A+, employment A+; Watch: amenities D+, health & safety D+, commute F.
- Cave Creek Unified District (4244) (urban): math 57% / reading 59% proficiency, ranked #13 of 249 in AZ (top 5%) — acceptable for families but not a draw, mixed tenant base, ~2y average lease; only 8% free/reduced lunch — higher-income household profile.
- Zoned schools: Black Mountain Elementary School (math 66% / reading 63%, grade B, #104 of 1,109 statewide, top 10%, 495 students, 8% FRL); Sonoran Trails Middle School (math 48% / reading 50%, grade C-, #31 of 218 statewide, top 14%, 761 students, 7% FRL); Cactus Shadows High School (math 49% / reading 46%, grade D, #48 of 381 statewide, top 13%, 1,588 students, 6% FRL) — zoned schools at 7% FRL track the district average.
- Market conditions: 101 active listings in the ZIP; 13 comparable units currently listed for rent nearby; rentals lingering (median 45d on market — plan ~5-8 weeks vacancy on turnover, expect pricing pressure); 85% of comp listings sitting > 30 days — soft ceiling on asking rent; 36,011 units permitted in Maricopa County in 2024 (12,801 in 5+ unit buildings).
- Maricopa County population projected at +38% by 2050 — long-run rental-demand tailwind backs the buy-and-hold thesis.
- At projected returns (6.1% appreciation + 3.0% rent growth), your $270k cash investment doubles in ~4 years — after that, you're playing with house money.
- By year 2, paydown + projected appreciation supports a ~$105k cash-out refi (75% LTV) — recoverable capital for the next deal without selling this one.
- Climate carrying-cost: major wildfire risk; extreme-heat days projected 7→17/yr by 2055 (HVAC capex compounding) — expect insurance premiums to compound above CPI over the hold.
- Cap rate 7.8% vs local median 4.0% in Carefree — top-decile yield for the area; either an underpriced asset or a hidden risk that comps aren't pricing in. Stress-test before assuming the spread holds.
Questions for listing agent
- Built in 1979 — when were the roof, HVAC, electrical panel, plumbing, and water heater last replaced?
- What does the HOA fee cover, when was the last increase, and are there any pending special assessments or reserve-fund shortfalls?
- Is there a deadline driving the sale (1031 exchange, divorce, estate, relocation)? That informs how much negotiation room exists.
- What's the average days-on-market for RENTAL listings here right now (not sales)? A rising rental-DOM trend means longer vacancies and softer asking-rent achievability than the comps imply.
- What's the recent tenant-quality profile in this submarket — average credit score on applications, eviction rate, late-payment / NSF rate, and stable-employment percentage? A property-management company in the area should have these aggregated.
- How much new for-sale + rental construction is in the pipeline within 1–3 miles? Heavy new supply typically softens prices + rents 12–24 months out; constrained supply supports both.
CashFlowRE · CFR-SFXAK95ZBAQPTC
· Data 2 h ago
cashflowre.app · 2026-05-29