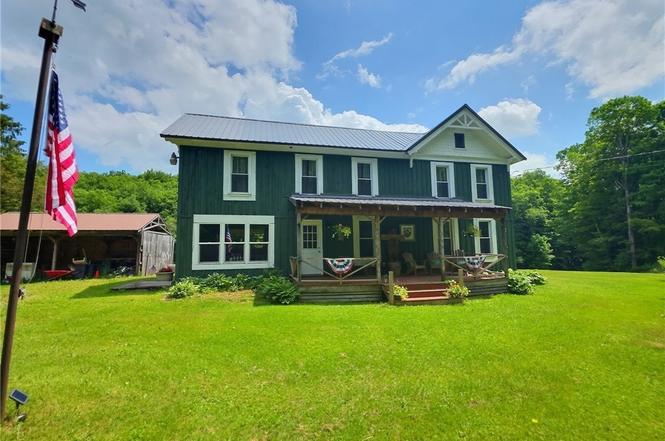
2360 Bear Swamp Rd
Homer, NY 13118
$289,900C+
5 bd · 1.0 ba ·
1,788 sqft ·
Built 1900
· SingleFamily
· Active
· 6 DOM
Cashflow @ list (25.0% down · 7.5%)
Estimated rent
$2,657/mo
Mortgage (P&I)
−$1,520
Tax + insurance
−$182
HOA
−$0
Vac / Maint / Mgmt
−$558
Net cashflow
$397/mo
Annual
$4,767/yr
Cap rate
7.94%
Cash-on-cash
5.87%
DSCR
1.26
1% rule
0.92%
Cash to close
$81,172
Investor read
- This is a 5-bed/1.0-bath single-family listed at $290k.
- At list price, monthly cash flow is $397 ($5k/yr) — positive.
- The deal already cash-flows at list — no discount required.
- To meet the 1% rule (rent ≥ 1% of price), the offer needs to be $266k (8.3% below list).
- Only 6 days on market — expect competitive offers; lowballing is unlikely to land.
- Recommended offer: $266k (8.3% below list) — sets the bar for 1% rule.
- In year one you build about $31k of equity ($2k loan paydown + $29k appreciation (10.0% local appreciation)).
- Location reads 76/100 on livability (#229 in NY, #3,609 nationally) — a middle-class / working-renter tenant base. Strengths: housing A+, health & safety A+, cost of living A; Watch: amenities F, commute F.
- Moravia Central School District (rural): math 42% / reading 56% proficiency, ranked #391 of 590 in NY (top 66%) — families likely to look elsewhere, expect single-tenant / working-renter base with shorter leases.
- Zoned schools: Millard Fillmore Elementary School (math 42% / reading 52%, grade D-, #1,195 of 2,108 statewide, top 60%, 387 students, 51% FRL); Moravia Junior-Senior High School (math 42% / reading 62%, grade D+, #946 of 1,100 statewide, top 88%, 476 students, 46% FRL).
- Watch-outs: built in 1900 — expect roof / HVAC / electrical / plumbing capex.
- Market conditions: 30 active listings in the ZIP; 161 units permitted in Cayuga County in 2024 (65 in 5+ unit buildings).
- Cayuga County population projected at -18% by 2050 — secular population decline; favor cash flow + early exit over multi-decade hold.
- 3 sale attempts since 8y ago with the ask held roughly flat each time — persistent listings suggest the price (not the market) is what's stuck; bring a comps-based counter.
- Current owner paid $52k; list at $290k implies a 458% gain — meaningful room to come down on a strong offer.
- At projected returns (10.0% appreciation + 3.0% rent growth), your $81k cash investment doubles in ~3 years — after that, you're playing with house money.
- By year 2, paydown + projected appreciation supports a ~$50k cash-out refi (75% LTV) — recoverable capital for the next deal without selling this one.
- Cap rate 7.9% vs local median 3.4% in Homer — top-decile yield for the area; either an underpriced asset or a hidden risk that comps aren't pricing in. Stress-test before assuming the spread holds.
Questions for listing agent
- Built in 1900 — when were the roof, HVAC, electrical panel, plumbing, and water heater last replaced?
- Is there a deadline driving the sale (1031 exchange, divorce, estate, relocation)? That informs how much negotiation room exists.
- Schools are B-rated — typically a magnet for longer-tenancy family renters. What's the average tenant stay here, and is there a school-zone premium baked into asking?
- What's the average days-on-market for RENTAL listings here right now (not sales)? A rising rental-DOM trend means longer vacancies and softer asking-rent achievability than the comps imply.
- What's the recent tenant-quality profile in this submarket — average credit score on applications, eviction rate, late-payment / NSF rate, and stable-employment percentage? A property-management company in the area should have these aggregated.
- How much new for-sale + rental construction is in the pipeline within 1–3 miles? Heavy new supply typically softens prices + rents 12–24 months out; constrained supply supports both.
CashFlowRE · CFR-SGZK5CD2TB7VZE
· Data 20 h ago
cashflowre.app · 2026-05-29