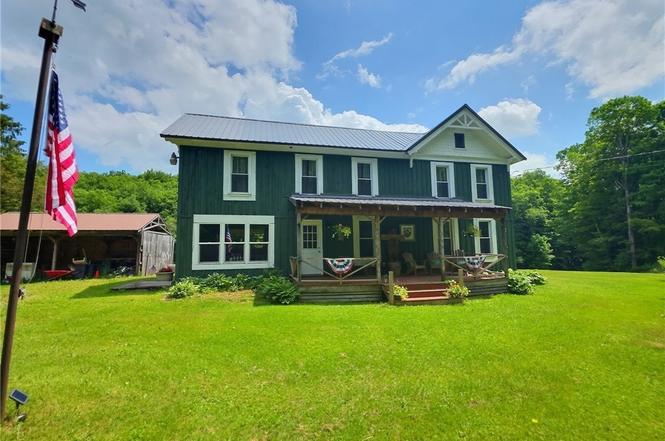
2360 Bear Swamp Rd · Homer, NY
Flood risk 1/10 · Minimal
- FEMA flood zone
- X (unshaded)
- Chance of flooding over 30 yrs
- 0.0%
- Est. flood insurance / yr
- $473 – $860
Fire risk 2/10 · Minimal
- Est. fire insurance / yr
- $691 – $1,283
Heat risk 1/10 · Minimal
- Hot days now (above 90°F)
- 7 days/yr
- Hot days in 30 yrs
- 15 days/yr
Wind risk 1/10 · Minimal
- Chance of severe wind over 30 yrs
- 1.0%
Air-quality risk 2/10 · Minimal
- Unhealthy air days now
- 0 days/yr
- Unhealthy air days in 30 yrs
- 1 days/yr
Risk factors via First Street. Map © Google.
Why this score? — see what drove the C+ grade
The composite is a weighted blend of 9 inputs, each scored 0–100. Each bar is that input's sub-score; the figure is the points it added to the 100-point composite (weight × sub-score).
- Cash flow +20.8/30.0
- Appreciation +10.0/10.0
- ARV discount +7.5/15.0
- DSCR +6.6/10.0
- 1% rule +4.2/10.0
- Schools +4.2/10.0
- Livability +3.8/5.0
- Rent growth +2.5/5.0
- Condition / age +2.5/5.0
$289,900
🖨 Deal sheet (PDF) 📄 Offer letter ✓ Due diligence
Listing remarks MLS
Big Country home on 5 acre lot! 4 bedrooms 1.5 baths with potential 5th bedroom downstairs!! Big front porch!! Large rooms with hardwood floors and tall ceilings!! Gorgeous private backyard includes an open area perfect for ball games, a stream and plenty of trees!! Home needs some TLC . ! 5 acre lot to be divided off larger lot. Taxes and assessment are based on larger parcel. House is conveying "as is". Survey is in the works. Call today to set up your showing appointment!!
Key facts
- Open-concept kitchen
- Restored farmhouse
- 5.18 acre lot
Tags
Property features AI
Finance
- Other: Lot approximately 5.18 acres (irregular shape, dimensions 589 x 370)
Exterior
- Parking: No garage
- Utilities: Electricity connected; High-speed internet available; Septic tank; Well water
- Home design: 2-story frame house; Metal roof; Entry level information not specified; Property listed as resale
- Construction: Wood siding; Spray foam insulation; Stone foundation; Existing (year built details)
- Exterior features: Gravel driveway; Private yard; Covered and open porch; Porch; Shed(s) and storage; Leased propane tank; See remarks
Interior
- Kitchen: Dishwasher; Gas oven; Gas range; Microwave; Refrigerator
- Bedrooms: Total rooms: 8; Room types include laundry, living room, den
- Flooring: Hardwood; Laminate; Varies
- Bathrooms: 1 full bathroom; Main level bathroom
- Heating & cooling: Propane forced air heating
- Interior features: Ceiling fans; Den; Eat-in kitchen; Separate/formal living room; Kitchen open to family room; Natural woodwork
- Laundry & utility: Washer and dryer on main level; Propane water heater; Tankless water heater
Neighborhood map
What this means for you Summary
Snapshot
- This is a 5-bed/1.0-bath single-family listed at $290k.
Deal economics
- At list price, monthly cash flow is $397 ($5k/yr) — positive.
- The deal already cash-flows at list — no discount required.
- To meet the 1% rule (rent ≥ 1% of price), the offer needs to be $266k (8.3% below list).
- Recommended offer: $266k (8.3% below list) — sets the bar for 1% rule.
- Cap rate 7.9% vs local median 3.4% in Homer — top-decile yield for the area; either an underpriced asset or a hidden risk that comps aren't pricing in. Stress-test before assuming the spread holds.
Location & tenants
- Location reads 76/100 on livability (#229 in NY, #3,609 nationally) — a middle-class / working-renter tenant base. Strengths: housing A+, health & safety A+, cost of living A; Watch: amenities F, commute F.
- Moravia Central School District (rural): math 42% / reading 56% proficiency, ranked #391 of 590 in NY (top 66%) — families likely to look elsewhere, expect single-tenant / working-renter base with shorter leases.
- Zoned schools: Millard Fillmore Elementary School (math 42% / reading 52%, grade D-, #1,195 of 2,108 statewide, top 60%, 387 students, 51% FRL); Moravia Junior-Senior High School (math 42% / reading 62%, grade D+, #946 of 1,100 statewide, top 88%, 476 students, 46% FRL).
- Market conditions: 30 active listings in the ZIP; 161 units permitted in Cayuga County in 2024 (65 in 5+ unit buildings).
Forward outlook
- In year one you build about $31k of equity ($2k loan paydown + $29k appreciation (10.0% local appreciation)).
- Cayuga County population projected at -18% by 2050 — secular population decline; favor cash flow + early exit over multi-decade hold.
- At projected returns (10.0% appreciation + 3.0% rent growth), your $81k cash investment doubles in ~3 years — after that, you're playing with house money.
- By year 2, paydown + projected appreciation supports a ~$50k cash-out refi (75% LTV) — recoverable capital for the next deal without selling this one.
Negotiation context
- Only 6 days on market — expect competitive offers; lowballing is unlikely to land.
- 3 sale attempts since 8y ago with the ask held roughly flat each time — persistent listings suggest the price (not the market) is what's stuck; bring a comps-based counter.
- Current owner paid $52k; list at $290k implies a 458% gain — meaningful room to come down on a strong offer.
Risks & watch-outs
- Watch-outs: built in 1900 — expect roof / HVAC / electrical / plumbing capex.
Questions for the listing agent
- Built in 1900 — when were the roof, HVAC, electrical panel, plumbing, and water heater last replaced?
- Is there a deadline driving the sale (1031 exchange, divorce, estate, relocation)? That informs how much negotiation room exists.
- Schools are B-rated — typically a magnet for longer-tenancy family renters. What's the average tenant stay here, and is there a school-zone premium baked into asking?
- What's the average days-on-market for RENTAL listings here right now (not sales)? A rising rental-DOM trend means longer vacancies and softer asking-rent achievability than the comps imply.
- What's the recent tenant-quality profile in this submarket — average credit score on applications, eviction rate, late-payment / NSF rate, and stable-employment percentage? A property-management company in the area should have these aggregated.
- How much new for-sale + rental construction is in the pipeline within 1–3 miles? Heavy new supply typically softens prices + rents 12–24 months out; constrained supply supports both.
Investment metrics
- 1% rule
- 0.92% ✗
- Cap rate
- 7.94%
- Cash-on-cash
- 5.87%
- DSCR
- 1.26
- GRM
- 9.1
CMA / ARV
No comps found within radius.
Projected returns pro-forma
10.0% appreciation · 3.0% rent growth · sell at horizon
- IRR
- 28.5%
- Equity multiple
- 3.25×
- Total profit
- $183,042
- Equity at exit
- $261,165
- IRR
- 24.8%
- Equity multiple
- 7.39×
- Total profit
- $518,843
- Equity at exit
- $563,212
Cash invested: $81,172 (down + closing). Projections, not guarantees.
Landlord ↔ Tenant lean methodology
- Overall (STATE)
- 15 Strongly Tenant-Friendly
- State New York
- 15 Strongly Tenant-Friendly · D+10
- County
- — inherits STATE
- City
- — inherits STATE
ZIP-level market 13118
- Home prices YoY
- 29.3%
- Active inventory
- 30
- Price-to-rent
- 9.1×
Monthly cashflow live
- Estimated rent
- $2,657 medium interval (Pro) →
- Mortgage (P&I)
- −$1,520
- Tax from tax record
- −$61 /mo · $731/yr
- Insurance
- −$121
- HOA
- −$0
- Vacancy / Maint / Mgmt
- −$558
- Net cashflow
- $397
Break-even live
Sensitivity live
| Price | -10% $561 | -5% $479 | +0% $397 | +5% $315 | +10% $233 |
|---|---|---|---|---|---|
| Rent | -10% $187 | -5% $292 | +0% $397 | +5% $502 | +10% $607 |
| Rate | -1.0pp $543 | -0.5pp $471 | base $397 | +0.5pp $322 | +1.0pp $246 |
UW: 25.0% down · 7.5% · 30yr · 1.5% tax · 5.0% vac · 8.0% maint · 8.0% mgmt
Financing live
Cash to close
- Down payment
- $72,475
- Closing costs
- $8,697
- Reserves months
- —
- Total cash needed
- —
Loan-product check · same deal, 3 products live
Conventional
25% down · 7.5% · 30yr
- Down + closing
- —
- Monthly P&I
- —
- Monthly cashflow
- —
- DSCR
- —
- Eligible?
- —
Personal DTI + credit; lowest rate.
DSCR
20% down · 8.5% · 30yr
- Down + closing
- —
- Monthly P&I
- —
- Monthly cashflow
- —
- DSCR
- —
- Eligible?
- —
No personal income docs; deal must DSCR.
Hard money
10% down · 12.0% · 12mo
- Down + closing
- —
- Monthly P&I
- —
- Monthly cashflow
- —
- DSCR
- —
- Eligible?
- —
Short-term bridge; refi at stabilization.
Listing history 6 events
-
2026-06-21days on market $289,900 Active 6 DOM
-
2026-06-19days on market $289,900 Active 4 DOM
-
2026-06-18days on market $289,900 Active 3 DOM
-
2026-06-17days on market $289,900 Active 2 DOM
-
2026-06-16remarks 699-char remark
-
2026-06-16$289,900 Active 1 DOM
ⓘ Source: listings_history table (triggers on properties + properties_extension) + one-shot
backfill from property_details.listing_events for pre-trigger history.
Tax reassessment forecast NY · Partial reset (capped growth)
- Current annual tax
- $731 · $61/mo
- Projected year-2 tax
- $2,815 · $235/mo
- Expected delta
- +$2,084/yr (+$174/mo · 285.0%)
ⓘ Screening estimate from a state-policy table — verify with the county assessor before closing.
Climate risk First Street
- Flood 1/10 Low FEMA zone X (unshaded) · 0% chance over 30 yrs
- Wildfire 2/10 Low
- Heat 1/10 Low 7 d/yr ≥90°F today · 15 d/yr by 30 yrs out
- Wind 1/10 Low 100% chance of damaging wind over 30 yrs
- Air quality 2/10 Low 0 unhealthy d/yr today · 1 by 30 yrs out
Nearby sold comps map
Loading sold comps map…
Walkable amenities ~0.75 mi
Loading nearby amenities…
Taxation est. · year 1
- Rental income
- $31,887
- − Mortgage interest
- −$16,239
- − Property taxes
- −$731
- − Insurance
- −$1,450
- − Repairs & maintenance
- −$2,551
- − Management
- −$2,551
- − Depreciation
- −$8,433
- Taxable loss
- −$68
- Est. tax savings @ 24.0%
- +$16
- After-tax cash flow
- $4,783/yr
For passive investors: Depreciation is non-cash, so a rental often shows a tax loss while cash-flowing — sheltering income. Rental losses are passive: they offset passive income freely, and up to $25,000/yr can offset ordinary (W-2) income if you actively participate and your MAGI is under $100k (phasing out to $0 by $150k); unused losses carry forward. On sale, claimed depreciation is recaptured at up to 25%, and gains may owe capital-gains tax (a 1031 exchange can defer both). Figures are a year-1 estimate at your 24.0% rate — not tax advice; consult a CPA.
Schools (NCES district)
- District
- Moravia Central School District
- NCES district ID
- 3619800
- Math proficiency
- 42% ▼ -2.00%
- Reading proficiency
- 56% ▲ 9.00%
- Median HH income
- $55,991
- Composite
- 42.47/100
- National rank
- #3215
- State rank
- #391 of 590 in NY
Livability — Homer
- Score
- 76/100
- State rank
- #229
- US rank
- #3609
Category grades
Schools grade is shown separately in the Schools card above.
Census & demographics
- Population (ZIP)
- 5,514
Population outlook (Cayuga County) Hauer SSP2
- Today (2025)
- 74,820 people
- By 2030
- 72,402 · -3.2%
- By 2040
- 66,917 · -10.6%
- By 2050
- 61,007 · -18.5%
- By 2075
- 48,047 · -35.8%
- By 2100
- 34,512 · -53.9%
Race, ethnicity, and origin ACS 2023
- Neighborhood character
- Predominantly White (87%)
- Race & ethnicity
- White 87% Black 6% Two or more races 4% Hispanic / Latino 3%
- Common ancestry
- Romanian 3% Iranian 3% Lithuanian 2%
- Foreign-born
- 1%
- Languages at home
- 98% English-only · Spanish 1%
Political lean MEDSL · Cayuga
- 2024 margin
- R (+13.0) · D 43.5% · R 56.5%
- 2008→2024 swing
- -21.5pp toward R · 2008: 8.5pp · 2024: -13.0pp
- All cycles
- 2024: R+13.0 2020: R+9.2 2016: R+13.2 2012: D+10.8 2008: D+8.5
Not yet ingested
- Civics
- —
Market trends
- HPI YoY
- ▲ 82.97%
- Current HPI
- 366.5746
- Rent YoY
- —
- Metro
- —
- State GDP YoY
- ▲ 2.60%
- F500 in state
- 92
Industry mix (Fortune 500 HQ in NY)
| Industry | F500 HQs | Revenue |
|---|---|---|
| Financial Services | 10 | $950B |
|
||
| Consumer Goods | 9 | $162B |
|
||
| Insurance | 4 | $225B |
|
||
| Telecommunications | 2 | $144B |
|
||
| Pharmaceuticals | 2 | $112B |
|
||
| Media / Entertainment | 2 | $69B |
|
||
Price history
+346.7% since first listed8 events — show timeline
- 2026-06-15 Listed $289,900 UNYREIS
- 2020-03-19 Sold (Public Records) $52,000 Public Records
- 2020-03-19 Sold (MLS) $52,000 UNYREIS
- 2019-12-18 Pending — UNYREIS
- 2019-10-21 Pending — UNYREIS
- 2019-08-04 Price Changed $64,900 UNYREIS
- 2018-10-22 Listed $69,900 UNYREIS
- 2018-10-22 Listed $64,900 IBRMLS
Property tax history
-11.8%/yrLatest (2021): $731 · -56.5% YoY. Source: county tax records.
Cash-flow waterfall
monthlySold comps — $/sqft
last 12 mo · ≤1 miLoading sold comps…