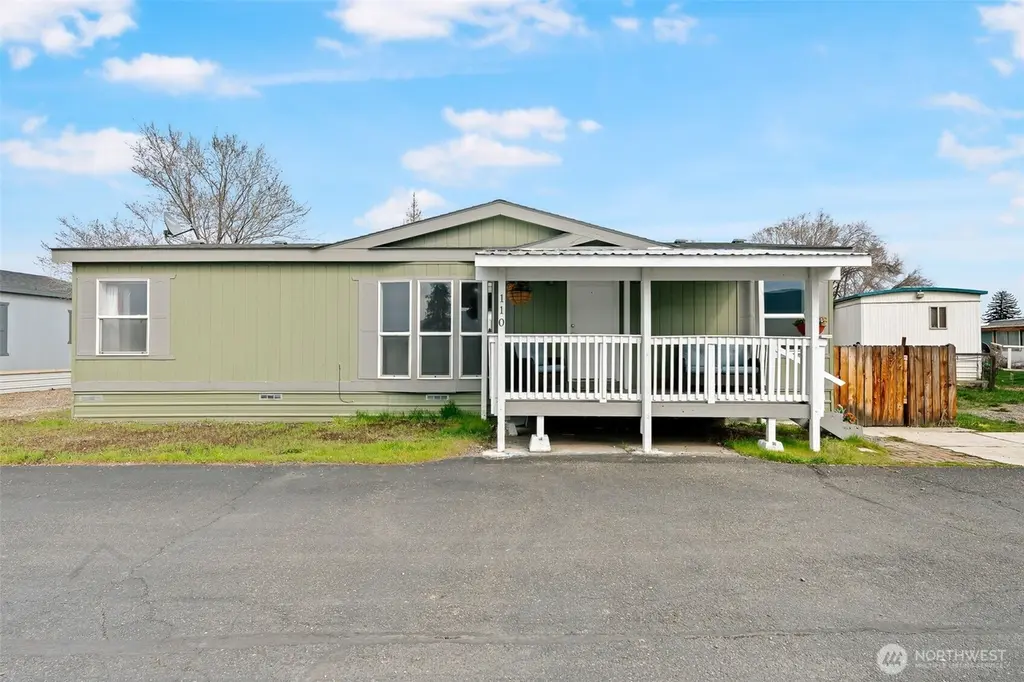
2900 S Canyon Rd #110
Ellensburg, WA 98926
$89,500B
3 bd · 2.0 ba ·
1,188 sqft ·
Built 1996
· Manufactured
· Pending
· 6 DOM
Cashflow @ list (25.0% down · 7.5%)
Estimated rent
$1,956/mo
Mortgage (P&I)
−$469
Tax + insurance
−$494
HOA
−$0
Vac / Maint / Mgmt
−$411
Net cashflow
$582/mo
Annual
$6,979/yr
Cap rate
19.81%
Cash-on-cash
48.27%
DSCR
3.15
1% rule
2.19%
Cash to close
$25,060
Investor read
- This is a 3-bed/2.0-bath manufactured listed at $90k.
- At list price, monthly cash flow is $582 ($7k/yr) — positive.
- The deal already cash-flows at list — no discount required.
- Meets the 1% rule at list price ($2k rent vs $90k).
- Only 6 days on market — expect competitive offers; lowballing is unlikely to land.
- Local home prices are declining (-3.0%/yr); year-one equity from $619 of loan paydown is wiped out by about $3k of value loss. Plan a longer hold.
- Location reads 82/100 on livability (#64 in WA, #1,157 nationally) — a professional / high-income tenant draw. Strengths: amenities A+, commute A+, health & safety A+; Watch: employment D-.
- Ellensburg School District (town): math 47% / reading 55% proficiency, ranked #148 of 291 in WA (top 51%) — acceptable for families but not a draw, mixed tenant base, ~2y average lease.
- Zoned schools: Valley View Elementary School (395 students, 33% FRL); Morgan Middle School (778 students, 50% FRL); Ellensburg High School (938 students, 40% FRL).
- Watch-outs: flood insurance adds $427/mo.
- Market conditions: Rents flat; 312 active listings in the ZIP; 433 units permitted in Kittitas County in 2024 (23 in 5+ unit buildings).
- Kittitas County population projected at +30% by 2050 — long-run rental-demand tailwind backs the buy-and-hold thesis.
- 2 sale attempts since 3y ago with the ask held roughly flat each time — persistent listings suggest the price (not the market) is what's stuck; bring a comps-based counter.
- At projected returns (-3.0% appreciation + 0.6% rent growth), your $25k cash investment doubles in ~5 years — after that, you're playing with house money.
- Climate carrying-cost: in FEMA flood zone AE (mandatory federal flood insurance) — expect insurance premiums to compound above CPI over the hold.
- Cap rate 19.8% vs local median 2.7% in Ellensburg — top-decile yield for the area; either an underpriced asset or a hidden risk that comps aren't pricing in. Stress-test before assuming the spread holds.
- This rent runs 33% of the median local income ($71k/yr) — at the standard rent-burdened threshold; future hikes will face affordability resistance.
Questions for listing agent
- What's the actual annual flood-insurance premium (NFIP or private), and is the property in a SFHA with mandatory coverage?
- Is there a deadline driving the sale (1031 exchange, divorce, estate, relocation)? That informs how much negotiation room exists.
- What's the average days-on-market for RENTAL listings here right now (not sales)? A rising rental-DOM trend means longer vacancies and softer asking-rent achievability than the comps imply.
- What's the recent tenant-quality profile in this submarket — average credit score on applications, eviction rate, late-payment / NSF rate, and stable-employment percentage? A property-management company in the area should have these aggregated.
- How much new for-sale + rental construction is in the pipeline within 1–3 miles? Heavy new supply typically softens prices + rents 12–24 months out; constrained supply supports both.
CashFlowRE · CFR-SH2841C26SK86Q
· Data 4 weeks ago
cashflowre.app · 2026-05-29