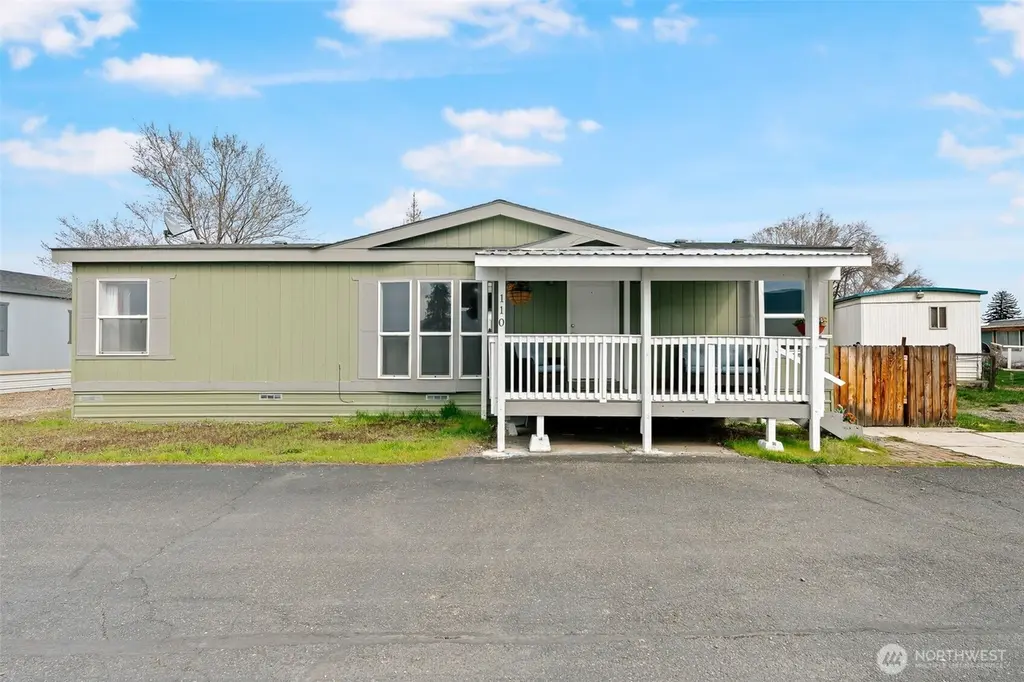
2900 S Canyon Rd #110 · Ellensburg, WA
Flood risk 8/10 · Major
- FEMA flood zone
- AE
- Chance of flooding over 30 yrs
- 0.99%
- Est. flood insurance / yr
- $1,737 – $8,500
Fire risk 4/10 · Minor
- Est. fire insurance / yr
- $604 – $1,122
Heat risk 3/10 · Minor
- Hot days now (above 94°F)
- 7 days/yr
- Hot days in 30 yrs
- 14 days/yr
Wind risk 1/10 · Minimal
- Chance of severe wind over 30 yrs
- —
Air-quality risk 9/10 · Severe
- Unhealthy air days now
- 17 days/yr
- Unhealthy air days in 30 yrs
- 18 days/yr
Risk factors via First Street. Map © Google.
Why this score? — see what drove the B grade
The composite is a weighted blend of 9 inputs, each scored 0–100. Each bar is that input's sub-score; the figure is the points it added to the 100-point composite (weight × sub-score).
- Cash flow +30.0/30.0
- 1% rule +10.0/10.0
- DSCR +10.0/10.0
- ARV discount +9.6/15.0
- Schools +4.5/10.0
- Livability +4.1/5.0
- Rent growth +2.6/5.0
- Condition / age +2.5/5.0
- Appreciation +0.0/10.0
$89,500
🖨 Deal sheet (PDF) 📄 Offer letter ✓ Due diligence
Listing remarks
Looking for a turnkey, low-maintenance home? This 3 bed 2 bath 1188 sq ft manufactured home in Millpond community park is waiting for you! All appliances new in 2024 (all appliances stay), new carpet in 2026 (all other flooring new in 2023), new water heater in 2024, fresh interior paint 2026, fresh exterior paint in 2023, and new roof in 2024. Whether you have sunbathing furry friends, plants, or just want to battle the seasons, the ample natural light from the commanding living room windows will inspire you. Large kitchen w/ dining area and office set up includes lots of storage, making it easy to keep every part of your home life organized. Large primary suit with walk in closet on one s
Key facts
- New carpet
- New water heater
- New appliances
Tags
Neighborhood map
What this means for you Summary
Snapshot
- This is a 3-bed/2.0-bath manufactured listed at $90k.
Deal economics
- At list price, monthly cash flow is $582 ($7k/yr) — positive.
- The deal already cash-flows at list — no discount required.
- Meets the 1% rule at list price ($2k rent vs $90k).
- Cap rate 19.8% vs local median 2.7% in Ellensburg — top-decile yield for the area; either an underpriced asset or a hidden risk that comps aren't pricing in. Stress-test before assuming the spread holds.
Location & tenants
- Location reads 82/100 on livability (#64 in WA, #1,157 nationally) — a professional / high-income tenant draw. Strengths: amenities A+, commute A+, health & safety A+; Watch: employment D-.
- Ellensburg School District (town): math 47% / reading 55% proficiency, ranked #148 of 291 in WA (top 51%) — acceptable for families but not a draw, mixed tenant base, ~2y average lease.
- Zoned schools: Valley View Elementary School (395 students, 33% FRL); Morgan Middle School (778 students, 50% FRL); Ellensburg High School (938 students, 40% FRL).
- Market conditions: Rents flat; 312 active listings in the ZIP; 433 units permitted in Kittitas County in 2024 (23 in 5+ unit buildings).
- This rent runs 33% of the median local income ($71k/yr) — at the standard rent-burdened threshold; future hikes will face affordability resistance.
Forward outlook
- Local home prices are declining (-3.0%/yr); year-one equity from $619 of loan paydown is wiped out by about $3k of value loss. Plan a longer hold.
- Kittitas County population projected at +30% by 2050 — long-run rental-demand tailwind backs the buy-and-hold thesis.
- At projected returns (-3.0% appreciation + 0.6% rent growth), your $25k cash investment doubles in ~5 years — after that, you're playing with house money.
Negotiation context
- Only 6 days on market — expect competitive offers; lowballing is unlikely to land.
- 2 sale attempts since 3y ago with the ask held roughly flat each time — persistent listings suggest the price (not the market) is what's stuck; bring a comps-based counter.
Risks & watch-outs
- Watch-outs: flood insurance adds $427/mo.
- Climate carrying-cost: in FEMA flood zone AE (mandatory federal flood insurance) — expect insurance premiums to compound above CPI over the hold.
Questions for the listing agent
- What's the actual annual flood-insurance premium (NFIP or private), and is the property in a SFHA with mandatory coverage?
- Is there a deadline driving the sale (1031 exchange, divorce, estate, relocation)? That informs how much negotiation room exists.
- What's the average days-on-market for RENTAL listings here right now (not sales)? A rising rental-DOM trend means longer vacancies and softer asking-rent achievability than the comps imply.
- What's the recent tenant-quality profile in this submarket — average credit score on applications, eviction rate, late-payment / NSF rate, and stable-employment percentage? A property-management company in the area should have these aggregated.
- How much new for-sale + rental construction is in the pipeline within 1–3 miles? Heavy new supply typically softens prices + rents 12–24 months out; constrained supply supports both.
Investment metrics
- 1% rule
- 2.19% ✓
- Cap rate
- 19.81%
- Cash-on-cash
- 48.27%
- DSCR
- 3.15
- GRM
- 3.8
CMA / ARV
- ARV (on-the-fly)
- $93,852
- Comps found
- 2
Show comp detail 2 sales within ~0.75 mi
| Address | Dist | Beds/Ba | Sqft | Sold | Price | $/sf | Match |
|---|---|---|---|---|---|---|---|
| 2900 S Canyon Rd #110 | 0.00mi | 3/2.0 | 1,188 (0%) | 0mo | $93,500 | $79 | 100 |
| 2900 S Canyon Rd #109 | 0.06mi | 3/2.0 | 1,144 (-4%) | 6mo | $84,500 | $74 | 86 |
Match score weights: distance 35% · size 25% · config 20% · recency 20%. Top-matched comps best support the ARV.
Projected returns pro-forma
-3.0% appreciation · 0.57% rent growth · sell at horizon
- IRR
- 18.5%
- Equity multiple
- 1.72×
- Total profit
- $18,112
- Equity at exit
- $13,345
- IRR
- 24.7%
- Equity multiple
- 2.84×
- Total profit
- $46,203
- Equity at exit
- $7,738
Cash invested: $25,060 (down + closing). Projections, not guarantees.
Landlord ↔ Tenant lean methodology
- Overall (STATE)
- 28 Tenant-Leaning
- State Washington
- 28 Tenant-Leaning · D+8
- County
- — inherits STATE
- City
- — inherits STATE
ZIP-level market 98926
- Rents YoY
- 0.6%
- Active inventory
- 312
- Price-to-rent
- 3.8×
Monthly cashflow live
- Estimated rent
- $1,956 medium interval (Pro) →
- Mortgage (P&I)
- −$469
- Tax from tax record
- −$30 /mo · $363/yr
- Insurance
- −$37
- Flood insurance flood zone
- −$427 /mo · $5,118/yr
- HOA
- −$0
- Vacancy / Maint / Mgmt
- −$411
- Net cashflow
- $582
Break-even live
Sensitivity live
| Price | -10% $632 | -5% $607 | +0% $582 | +5% $556 | +10% $531 |
|---|---|---|---|---|---|
| Rent | -10% $427 | -5% $504 | +0% $582 | +5% $659 | +10% $736 |
| Rate | -1.0pp $627 | -0.5pp $604 | base $582 | +0.5pp $558 | +1.0pp $535 |
UW: 25.0% down · 7.5% · 30yr · 1.5% tax · 5.0% vac · 8.0% maint · 8.0% mgmt
Financing live
Cash to close
- Down payment
- $22,375
- Closing costs
- $2,685
- Reserves months
- —
- Total cash needed
- —
Loan-product check · same deal, 3 products live
Conventional
25% down · 7.5% · 30yr
- Down + closing
- —
- Monthly P&I
- —
- Monthly cashflow
- —
- DSCR
- —
- Eligible?
- —
Personal DTI + credit; lowest rate.
DSCR
20% down · 8.5% · 30yr
- Down + closing
- —
- Monthly P&I
- —
- Monthly cashflow
- —
- DSCR
- —
- Eligible?
- —
No personal income docs; deal must DSCR.
Hard money
10% down · 12.0% · 12mo
- Down + closing
- —
- Monthly P&I
- —
- Monthly cashflow
- —
- DSCR
- —
- Eligible?
- —
Short-term bridge; refi at stabilization.
Listing history 5 events
-
2026-03-31status Pending
-
2026-03-25$89,500 Active
-
2024-01-16soldstatus $85,000 Closed
-
2023-11-19status Pending - Backup Offer Requested
-
2023-11-10$85,000 Active
ⓘ Source: listings_history table (triggers on properties + properties_extension) + one-shot
backfill from property_details.listing_events for pre-trigger history.
Tax reassessment forecast WA · Resets to sale price
- Current annual tax
- $363 · $30/mo
- Projected year-2 tax
- $877 · $73/mo
- Expected delta
- +$514/yr (+$43/mo · 141.4%)
ⓘ Screening estimate from a state-policy table — verify with the county assessor before closing.
Climate risk First Street
- Flood 8/10 Severe FEMA zone AE · 99% chance over 30 yrs
- Wildfire 4/10 Moderate
- Heat 3/10 Moderate 7 d/yr ≥94°F today · 14 d/yr by 30 yrs out
- Wind 1/10 Low
- Air quality 9/10 Extreme 17 unhealthy d/yr today · 18 by 30 yrs out
Nearby sold comps map
Loading sold comps map…
Walkable amenities ~0.75 mi
Loading nearby amenities…
Taxation est. · year 1
- Rental income
- $23,469
- − Mortgage interest
- −$5,013
- − Property taxes
- −$363
- − Insurance
- −$5,566
- − Repairs & maintenance
- −$1,878
- − Management
- −$1,878
- − Depreciation
- −$2,604
- Taxable income
- $6,168
- Est. tax owed @ 24.0%
- −$1,480
- After-tax cash flow
- $5,499/yr
For passive investors: Depreciation is non-cash, so a rental often shows a tax loss while cash-flowing — sheltering income. Rental losses are passive: they offset passive income freely, and up to $25,000/yr can offset ordinary (W-2) income if you actively participate and your MAGI is under $100k (phasing out to $0 by $150k); unused losses carry forward. On sale, claimed depreciation is recaptured at up to 25%, and gains may owe capital-gains tax (a 1031 exchange can defer both). Figures are a year-1 estimate at your 24.0% rate — not tax advice; consult a CPA.
Schools (NCES district)
- District
- Ellensburg School District
- NCES district ID
- 5302460
- Math proficiency
- 47% ▲ 1.00%
- Reading proficiency
- 55% ▲ 2.00%
- Median HH income
- $39,944
- Composite
- 44.61/100
- National rank
- #6026
- State rank
- #148 of 291 in WA
Livability — Ellensburg
- Score
- 82/100
- State rank
- #64
- US rank
- #1157
Category grades
Schools grade is shown separately in the Schools card above.
Census & demographics
- County
- Kittitas County · 34,353 people
- City population
- 34,353
- Metro
- Ellensburg, WA
- Population (ZIP)
- 34,353
- Household income
- $71,137
- Rent vs Own
- Severe rent burden
- 2076.0
Population outlook (Kittitas County) Hauer SSP2
- Today (2025)
- 48,605 people
- By 2030
- 51,628 · +6.2%
- By 2040
- 57,361 · +18.0%
- By 2050
- 63,241 · +30.1%
- By 2075
- 79,310 · +63.2%
- By 2100
- 94,769 · +95.0%
Race, ethnicity, and origin ACS 2023
- Neighborhood character
- Predominantly White (79%)
- Race & ethnicity
- White 79% Hispanic / Latino 11% Two or more races 9% Asian 2% Black 1%
- Hispanic origin (detail)
- Mexican 8%
- Common ancestry
- Italian 9% Portuguese 4% Slovak 3%
- Foreign-born
- 5% · Canada
- Languages at home
- 91% English-only · Spanish 6% Other Indo-European 1% German/W. Germanic 1%
Political lean MEDSL · Kittitas
- 2024 margin
- R (+14.6) · D 41.1% · R 55.7% · Other 3.2%
- 2008→2024 swing
- -6.5pp toward R · 2008: -8.1pp · 2024: -14.6pp
- All cycles
- 2024: R+14.6 2020: R+10.2 2016: R+14.5 2012: R+12.6 2008: R+8.1
Not yet ingested
- Civics
- —
Market trends
- HPI YoY
- ▼ -193.62%
- Current HPI
- 211.3198
- Rent YoY
- ▲ 0.57%
- Metro
- Ellensburg, WA
- State GDP YoY
- ▲ 4.65%
- F500 in state
- 22
Industry mix (Fortune 500 HQ in WA)
| Industry | F500 HQs | Revenue |
|---|---|---|
| Retail | 2 | $269B |
|
||
| Technology / Retail | 1 | $638B |
|
||
| Technology | 1 | $245B |
|
||
| Telecommunications | 1 | $38B |
|
||
| Food / Beverage | 1 | $36B |
|
||
| Automotive / Trucks | 1 | $34B |
|
||
Price history
+5.3% since first listed5 events — show timeline
- 2026-03-31 Pending — NWMLS as Distributed by MLS Grid
- 2026-03-25 Listed $89,500 NWMLS as Distributed by MLS Grid
- 2024-01-16 Sold (MLS) $85,000 NWMLS as Distributed by MLS Grid
- 2023-11-19 Pending — NWMLS as Distributed by MLS Grid
- 2023-11-10 Listed $85,000 NWMLS as Distributed by MLS Grid
Property tax history
+1.3%/yrLatest (2026): $363 · +5.3% YoY. Source: county tax records.
Cash-flow waterfall
monthlySold comps — $/sqft
last 12 mo · ≤1 miLoading sold comps…