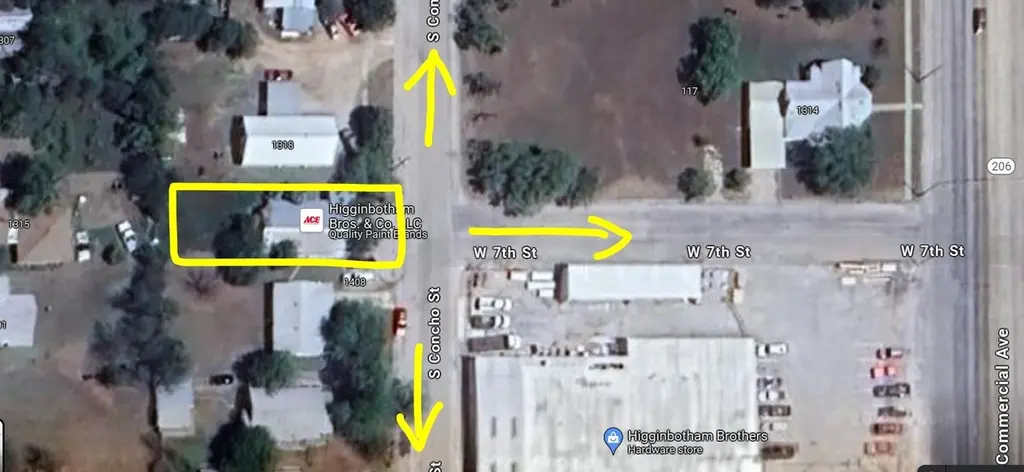
1400 S Concho St
Coleman, TX 76834
$32,900B+
1 bd · 1.0 ba ·
1,784 sqft ·
Built 1950
· SingleFamily
· Active
· 17 DOM
Cashflow @ list (25.0% down · 7.5%)
Estimated rent
$905/mo
Mortgage (P&I)
−$173
Tax + insurance
−$55
HOA
−$0
Vac / Maint / Mgmt
−$190
Net cashflow
$488/mo
Annual
$5,855/yr
Cap rate
24.09%
Cash-on-cash
63.55%
DSCR
3.83
1% rule
2.75%
Cash to close
$9,212
Investor read
- This is a 1-bed/1.0-bath single-family listed at $33k. Condition is rated poor.
- At list price, monthly cash flow is $488 ($6k/yr) — positive.
- The deal already cash-flows at list — no discount required.
- Meets the 1% rule at list price ($905 rent vs $33k).
- It's been on market 17 days — a 2% lower offer ($32k) is reasonable based on typical stale-listing flexibility.
- Recommended offer: $32k (1.5% below list) — sets the bar for market timing.
- In year one you build about $2k of equity ($227 loan paydown + $2k appreciation (5.7% local appreciation)).
- Location reads 68/100 on livability (#454 in TX) — a middle-class / working-renter tenant base. Strengths: crime A+, cost of living A+, housing A+; Watch: health & safety D+, amenities F, commute F.
- Coleman ISD (town): math 42% / reading 39% proficiency, ranked #439 of 826 in TX (top 53%) — families likely to look elsewhere, expect single-tenant / working-renter base with shorter leases.
- Zoned schools: Coleman El (math 32% / reading 27%, grade F, #2,525 of 4,322 statewide, top 62%, 339 students, 69% FRL); Coleman J H (math 47% / reading 45%, grade D+, #462 of 1,662 statewide, top 28%, 252 students, 56% FRL); Coleman H S (math 44% / reading 42%, grade F, #708 of 1,632 statewide, top 44%, 203 students, 42% FRL) — zoned schools at 56% FRL track the district average.
- Watch-outs: built in 1950 — expect roof / HVAC / electrical / plumbing capex.
- Market conditions: 120 active listings in the ZIP; 5 units permitted in Coleman County in 2024 (0 in 5+ unit buildings).
- Coleman County population projected at -28% by 2050 — secular population decline; favor cash flow + early exit over multi-decade hold.
- 3 sale attempts since 6y ago with the ask held roughly flat each time — persistent listings suggest the price (not the market) is what's stuck; bring a comps-based counter.
- At projected returns (5.7% appreciation + 3.0% rent growth), your $9k cash investment doubles in ~2 years — after that, you're playing with house money.
- Cap rate 24.1% vs local median 4.5% in Coleman — top-decile yield for the area; either an underpriced asset or a hidden risk that comps aren't pricing in. Stress-test before assuming the spread holds.
Questions for listing agent
- Have any recent inspections been done? Can we get a copy of the seller's disclosures and any deferred-maintenance estimates?
- Built in 1950 — when were the roof, HVAC, electrical panel, plumbing, and water heater last replaced?
- Is there a deadline driving the sale (1031 exchange, divorce, estate, relocation)? That informs how much negotiation room exists.
- Schools are F-rated, which usually means shorter tenancies and higher turnover. Who's the typical renter profile here, and what's been the actual vacancy rate?
- What's the average days-on-market for RENTAL listings here right now (not sales)? A rising rental-DOM trend means longer vacancies and softer asking-rent achievability than the comps imply.
- What's the recent tenant-quality profile in this submarket — average credit score on applications, eviction rate, late-payment / NSF rate, and stable-employment percentage? A property-management company in the area should have these aggregated.
- How much new for-sale + rental construction is in the pipeline within 1–3 miles? Heavy new supply typically softens prices + rents 12–24 months out; constrained supply supports both.
Repairs flagged (vision-AI assessment)
- Major: exterior paint — Peeling paint indicates significant deterioration
- Major: windows — Broken windows suggest structural damage
- Major: roof — Visible damage to the roof
CashFlowRE · CFR-SH38SF4YT9SAZ5
· Data 1 h ago
cashflowre.app · 2026-05-29