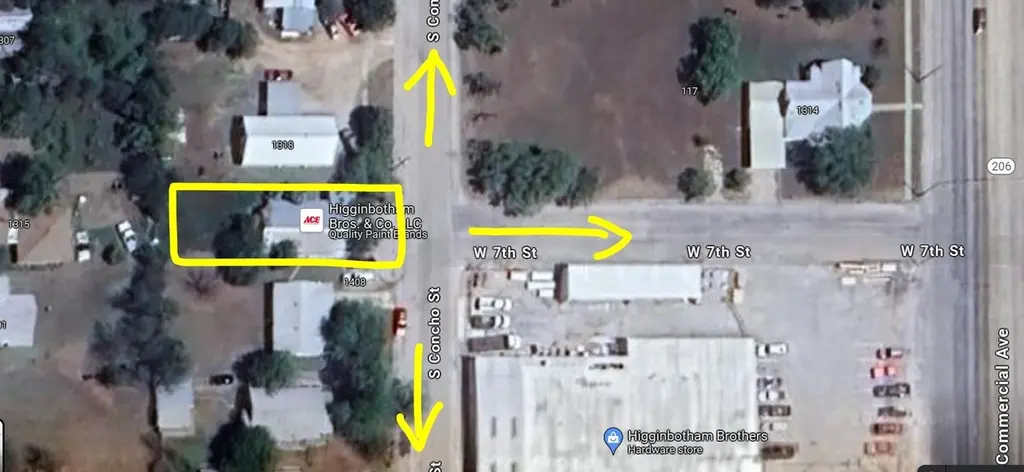
1400 S Concho St · Coleman, TX
Flood risk No data
- FEMA flood zone
- —
- Chance of flooding over 30 yrs
- —
- Est. flood insurance / yr
- —
Fire risk No data
- Est. fire insurance / yr
- —
Heat risk No data
- Hot days now (above threshold)
- —
- Hot days in 30 yrs
- —
Wind risk No data
- Chance of severe wind over 30 yrs
- —
Air-quality risk No data
- Unhealthy air days now
- —
- Unhealthy air days in 30 yrs
- —
Risk factors via First Street. Map © Google.
Why this score? — see what drove the B+ grade
The composite is a weighted blend of 9 inputs, each scored 0–100. Each bar is that input's sub-score; the figure is the points it added to the 100-point composite (weight × sub-score).
- Cash flow +30.0/30.0
- 1% rule +10.0/10.0
- DSCR +10.0/10.0
- Appreciation +7.8/10.0
- ARV discount +7.5/15.0
- Livability +3.4/5.0
- Schools +3.3/10.0
- Rent growth +2.5/5.0
- Condition / age +1.0/5.0
$32,900
🖨 Deal sheet (PDF) 📄 Offer letter ✓ Due diligence
Listing remarks
Property zoned to commercial. Previously used as laundromat. Conveniently located at one block away from a major shop in town. Huge potential. Priced at lot value. Dream of owning a piece of commercial property, here is your chance.
Key facts
- Huge potential
- Zoned to commercial
- Priced at lot value
Tags
Property features AI
Finance
- Other: Total building area approximately 1,784; Lot size approximately 7,188 square feet (0.17 acre)
- Financial info: Lease not considered
Exterior
- Utilities: Public water; Public sewer
- Home design: Residential property; One-story (single level); Built in 1950
- Construction: Brick construction
- Exterior features: Metal roof; Lot includes 'Other' features
Interior
- Bedrooms: Bedroom on the first floor (20 x 50)
- Bathrooms: Two half bathrooms
- Heating & cooling: Window heating; Window cooling units
- Interior features: One main room listed
Neighborhood map
What this means for you Summary
Snapshot
- This is a 1-bed/1.0-bath single-family listed at $33k. Condition is rated poor.
Deal economics
- At list price, monthly cash flow is $488 ($6k/yr) — positive.
- The deal already cash-flows at list — no discount required.
- Meets the 1% rule at list price ($905 rent vs $33k).
- Recommended offer: $32k (1.5% below list) — sets the bar for market timing.
- Cap rate 24.1% vs local median 4.5% in Coleman — top-decile yield for the area; either an underpriced asset or a hidden risk that comps aren't pricing in. Stress-test before assuming the spread holds.
Location & tenants
- Location reads 68/100 on livability (#454 in TX) — a middle-class / working-renter tenant base. Strengths: crime A+, cost of living A+, housing A+; Watch: health & safety D+, amenities F, commute F.
- Coleman ISD (town): math 42% / reading 39% proficiency, ranked #439 of 826 in TX (top 53%) — families likely to look elsewhere, expect single-tenant / working-renter base with shorter leases.
- Zoned schools: Coleman El (math 32% / reading 27%, grade F, #2,525 of 4,322 statewide, top 62%, 339 students, 69% FRL); Coleman J H (math 47% / reading 45%, grade D+, #462 of 1,662 statewide, top 28%, 252 students, 56% FRL); Coleman H S (math 44% / reading 42%, grade F, #708 of 1,632 statewide, top 44%, 203 students, 42% FRL) — zoned schools at 56% FRL track the district average.
- Market conditions: 121 active listings in the ZIP; 5 units permitted in Coleman County in 2024 (0 in 5+ unit buildings).
Forward outlook
- In year one you build about $2k of equity ($227 loan paydown + $2k appreciation (5.7% local appreciation)).
- Coleman County population projected at -28% by 2050 — secular population decline; favor cash flow + early exit over multi-decade hold.
- At projected returns (5.7% appreciation + 3.0% rent growth), your $9k cash investment doubles in ~2 years — after that, you're playing with house money.
Negotiation context
- It's been on market 16 days — a 2% lower offer ($32k) is reasonable based on typical stale-listing flexibility.
- 3 sale attempts since 6y ago with the ask held roughly flat each time — persistent listings suggest the price (not the market) is what's stuck; bring a comps-based counter.
Risks & watch-outs
- Watch-outs: built in 1950 — expect roof / HVAC / electrical / plumbing capex.
Questions for the listing agent
- Have any recent inspections been done? Can we get a copy of the seller's disclosures and any deferred-maintenance estimates?
- Built in 1950 — when were the roof, HVAC, electrical panel, plumbing, and water heater last replaced?
- Is there a deadline driving the sale (1031 exchange, divorce, estate, relocation)? That informs how much negotiation room exists.
- Schools are F-rated, which usually means shorter tenancies and higher turnover. Who's the typical renter profile here, and what's been the actual vacancy rate?
- What's the average days-on-market for RENTAL listings here right now (not sales)? A rising rental-DOM trend means longer vacancies and softer asking-rent achievability than the comps imply.
- What's the recent tenant-quality profile in this submarket — average credit score on applications, eviction rate, late-payment / NSF rate, and stable-employment percentage? A property-management company in the area should have these aggregated.
- How much new for-sale + rental construction is in the pipeline within 1–3 miles? Heavy new supply typically softens prices + rents 12–24 months out; constrained supply supports both.
Investment metrics
- 1% rule
- 2.75% ✓
- Cap rate
- 24.09%
- Cash-on-cash
- 63.55%
- DSCR
- 3.83
- GRM
- 3.0
CMA / ARV
- ARV (on-the-fly)
- $156,992
- Comps found
- 1
Show comp detail 1 sale within ~0.75 mi
| Address | Dist | Beds/Ba | Sqft | Sold | Price | $/sf | Match |
|---|---|---|---|---|---|---|---|
| 712 S Commercial Ave | 0.38mi | 2/2.0 (+1) | 1,815 (+2%) | 16mo | $159,000 | $88 | 57 |
Match score weights: distance 35% · size 25% · config 20% · recency 20%. Top-matched comps best support the ARV.
Projected returns pro-forma
5.66% appreciation · 3.0% rent growth · sell at horizon
- IRR
- 71.0%
- Equity multiple
- 5.33×
- Total profit
- $39,927
- Equity at exit
- $19,981
- IRR
- 68.3%
- Equity multiple
- 11.13×
- Total profit
- $93,326
- Equity at exit
- $35,644
Cash invested: $9,212 (down + closing). Projections, not guarantees.
Landlord ↔ Tenant lean methodology
- Overall (STATE)
- 87 Strongly Landlord-Friendly
- State Texas
- 87 Strongly Landlord-Friendly · R+5
- County
- — inherits STATE
- City
- — inherits STATE
ZIP-level market 76834
- Home prices YoY
- 4.8%
- Active inventory
- 121
- Price-to-rent
- 3.0×
Monthly cashflow live
- Estimated rent
- $905 medium interval (Pro) →
- Mortgage (P&I)
- −$173
- Tax est. 1.5%
- −$41 /mo · $494/yr
- Insurance
- −$14
- HOA
- −$0
- Vacancy / Maint / Mgmt
- −$190
- Net cashflow
- $488
Break-even live
Sensitivity live
| Price | -10% $511 | -5% $499 | +0% $488 | +5% $477 | +10% $465 |
|---|---|---|---|---|---|
| Rent | -10% $416 | -5% $452 | +0% $488 | +5% $524 | +10% $559 |
| Rate | -1.0pp $504 | -0.5pp $496 | base $488 | +0.5pp $479 | +1.0pp $471 |
UW: 25.0% down · 7.5% · 30yr · 1.5% tax · 5.0% vac · 8.0% maint · 8.0% mgmt
Financing live
Cash to close
- Down payment
- $8,225
- Closing costs
- $987
- Reserves months
- —
- Total cash needed
- —
Loan-product check · same deal, 3 products live
Conventional
25% down · 7.5% · 30yr
- Down + closing
- —
- Monthly P&I
- —
- Monthly cashflow
- —
- DSCR
- —
- Eligible?
- —
Personal DTI + credit; lowest rate.
DSCR
20% down · 8.5% · 30yr
- Down + closing
- —
- Monthly P&I
- —
- Monthly cashflow
- —
- DSCR
- —
- Eligible?
- —
No personal income docs; deal must DSCR.
Hard money
10% down · 12.0% · 12mo
- Down + closing
- —
- Monthly P&I
- —
- Monthly cashflow
- —
- DSCR
- —
- Eligible?
- —
Short-term bridge; refi at stabilization.
Listing history 13 events
-
2026-06-21days on market $32,900 Active 16 DOM
-
2026-06-21days on market $32,900 Active 15 DOM
-
2026-06-18days on market $32,900 Active 13 DOM
-
2026-06-17days on market $32,900 Active 12 DOM
-
2026-06-16days on market $32,900 Active 11 DOM
-
2026-06-15days on market $32,900 Active 10 DOM
-
2026-06-13days on market $32,900 Active 8 DOM
-
2026-06-12days on market $32,900 Active 7 DOM
-
2026-06-09days on market $32,900 Active 4 DOM
-
2026-06-08days on market $32,900 Active 3 DOM
-
2026-06-08days on market $32,900 Active 2 DOM
-
2026-06-07remarks 232-char remark
-
2026-06-07$32,900 Active 1 DOM
ⓘ Source: listings_history table (triggers on properties + properties_extension) + one-shot
backfill from property_details.listing_events for pre-trigger history.
Nearby sold comps map
Loading sold comps map…
Walkable amenities ~0.75 mi
Loading nearby amenities…
Taxation est. · year 1
- Rental income
- $10,864
- − Mortgage interest
- −$1,843
- − Property taxes
- −$494
- − Insurance
- −$164
- − Repairs & maintenance
- −$869
- − Management
- −$869
- − Depreciation
- −$957
- Taxable income
- $5,668
- Est. tax owed @ 24.0%
- −$1,360
- After-tax cash flow
- $4,494/yr
For passive investors: Depreciation is non-cash, so a rental often shows a tax loss while cash-flowing — sheltering income. Rental losses are passive: they offset passive income freely, and up to $25,000/yr can offset ordinary (W-2) income if you actively participate and your MAGI is under $100k (phasing out to $0 by $150k); unused losses carry forward. On sale, claimed depreciation is recaptured at up to 25%, and gains may owe capital-gains tax (a 1031 exchange can defer both). Figures are a year-1 estimate at your 24.0% rate — not tax advice; consult a CPA.
Condition & rehab AI · 4 photos
This property requires extensive repairs and maintenance, including exterior paint, new windows, and roof repair. Significant investment is needed to bring it up to a livable condition.
Repairs flagged
- Major exterior paint — Peeling paint indicates significant deterioration
- Major windows — Broken windows suggest structural damage
- Major roof — Visible damage to the roof
Value-add opportunities
- Both exterior paint job — Fresh paint can significantly improve curb appeal and value
- Both new windows — New windows can improve energy efficiency and safety
- Both roof repair — A new roof is essential for structural integrity and longevity
Renovation cost estimate screening
| Repair item | Severity | Est. cost |
|---|---|---|
| exterior paint · Peeling paint indicates significant deterioration | Major | $15,000–50,000 |
| windows · Broken windows suggest structural damage | Major | $15,000–50,000 |
| roof · Visible damage to the roof | Major | $15,000–50,000 |
| Total estimated repair cost · 3 items | $45,000–150,000 |
Value-add ROI direction
- Both exterior paint job — Fresh paint can significantly improve curb appeal and value ↑
- Both new windows — New windows can improve energy efficiency and safety ↑
- Both roof repair — A new roof is essential for structural integrity and longevity ↑
ⓘ Cost ranges are severity-bucket heuristics (US national rule-of-thumb). Get contractor quotes + a written scope before underwriting a rehab budget.
Schools (NCES district)
- District
- Coleman ISD
- NCES district ID
- 4814550
- Math proficiency
- 42% ▲ 3.00%
- Reading proficiency
- 39% ▲ 3.00%
- Median HH income
- $31,765
- Composite
- 33.18/100
- National rank
- #5540
- State rank
- #439 of 826 in TX
Livability — Coleman
- Score
- 68/100
- State rank
- #454
- US rank
- #9173
Category grades
Schools grade is shown separately in the Schools card above.
Census & demographics
- Census place
- Coleman, TX
- Population (ZIP)
- 4,861
Population outlook (Coleman County) Hauer SSP2
- Today (2025)
- 7,321 people
- By 2030
- 6,834 · -6.7%
- By 2040
- 5,968 · -18.5%
- By 2050
- 5,283 · -27.8%
- By 2075
- 4,205 · -42.6%
- By 2100
- 3,405 · -53.5%
Race, ethnicity, and origin ACS 2023
- Neighborhood character
- Predominantly White (76%)
- Race & ethnicity
- White 76% Hispanic / Latino 20% Two or more races 13% Black 3%
- Hispanic origin (detail)
- Mexican 18%
- Common ancestry
- Italian 16% Slovak 8% Serbian 3%
- Foreign-born
- 7% · Canada
- Languages at home
- 79% English-only · Spanish 21%
Political lean MEDSL · Coleman
- 2024 margin
- Solid R (+79.0) · D 10.3% · R 89.3%
- 2008→2024 swing
- -15.1pp toward R · 2008: -64.0pp · 2024: -79.0pp
- All cycles
- 2024: R+79.0 2020: R+77.3 2016: R+76.8 2012: R+73.7 2008: R+64.0
Not yet ingested
- Civics
- —
Market trends
- HPI YoY
- ▲ 5.66%
- Current HPI
- 123.8456
- Rent YoY
- —
- Metro
- —
- State GDP YoY
- ▲ 3.95%
- F500 in state
- 110
Industry mix (Fortune 500 HQ in TX)
| Industry | F500 HQs | Revenue |
|---|---|---|
| Energy | 16 | $1,198B |
|
||
| Technology | 5 | $198B |
|
||
| Engineering / Construction | 4 | $72B |
|
||
| Energy Services | 3 | $60B |
|
||
| Utilities | 3 | $41B |
|
||
| Healthcare | 2 | $330B |
|
||
Price history
+135.0% since first listed6 events — show timeline
- 2026-05-21 Listed $32,900 HARMLS
- 2026-02-26 Listing Removed — HARMLS
- 2025-12-08 Price Changed $34,900 HARMLS
- 2025-02-26 Listed $50,000 HARMLS
- 2020-09-09 Listing Removed — HARMLS
- 2020-08-31 Listed $14,000 HARMLS
Cash-flow waterfall
monthlySold comps — $/sqft
last 12 mo · ≤1 miLoading sold comps…