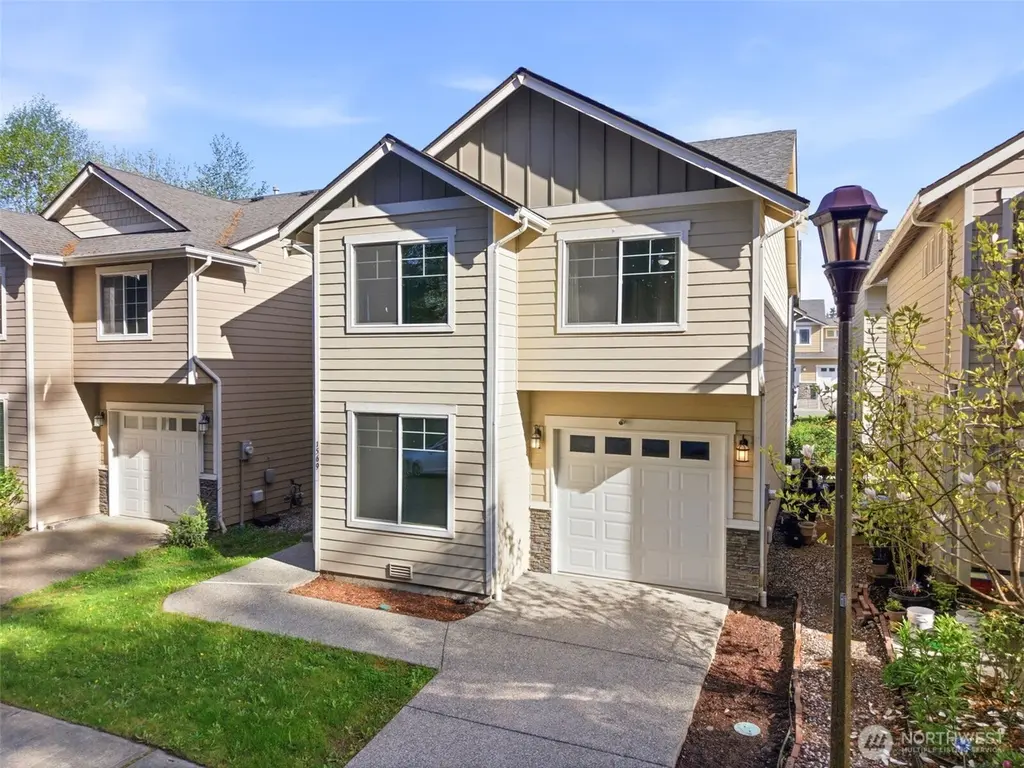
1569 NE Fontaine Way
Poulsbo, WA 98370
$475,000D
4 bd · 2.5 ba ·
1,682 sqft ·
Built 2014
· SingleFamily
· Active
· 57 DOM
Cashflow @ list (25.0% down · 7.5%)
Estimated rent
$3,258/mo
Mortgage (P&I)
−$2,491
Tax + insurance
−$541
HOA
−$27
Vac / Maint / Mgmt
−$684
Net cashflow
$-486/mo
Annual
$-5,827/yr
Cap rate
5.07%
Cash-on-cash
-4.38%
DSCR
0.81
1% rule
0.69%
Cash to close
$133,000
Investor read
- This is a 4-bed/2.5-bath single-family listed at $475k.
- At list price, monthly cash flow is $-486 ($-6k/yr) — negative.
- To cash-flow at today's rent, offer at most $389k (18.1% below list).
- To meet the 1% rule (rent ≥ 1% of price), the offer needs to be $326k (31.4% below list).
- It's been on market 57 days — a 3% lower offer ($461k) is reasonable based on typical stale-listing flexibility.
- Recommended offer: $326k (31.4% below list) — sets the bar for 1% rule.
- Local home prices are declining (-3.0%/yr); year-one equity from $3k of loan paydown is wiped out by about $14k of value loss. Plan a longer hold.
- Location reads 85/100 on livability (#30 in WA, #508 nationally) — a professional / high-income tenant draw. Strengths: amenities A+, commute A+, employment A+; Watch: cost of living F.
- North Kitsap School District (suburban): math 53% / reading 65% proficiency, ranked #54 of 291 in WA (top 19%) — acceptable for families but not a draw, mixed tenant base, ~2y average lease.
- Zoned schools: Poulsbo Elementary School (448 students, 26% FRL); Poulsbo Middle School (685 students, 30% FRL); North Kitsap High School (1,063 students, 29% FRL) — zoned schools at 28% FRL track the district average.
- Market conditions: Rents flat; 270 active listings in the ZIP; 2 comparable units currently listed for rent nearby; high-income renter base; 1,294 units permitted in Kitsap County in 2024 (302 in 5+ unit buildings).
- Kitsap County population projected at +8% by 2050 — modest demand growth; plan on rents tracking national, not racing it.
- 2 sale attempts since 3y ago with the ask held roughly flat each time — persistent listings suggest the price (not the market) is what's stuck; bring a comps-based counter.
- Cap rate 5.1% vs local median 2.7% in Poulsbo — top-decile yield for the area; either an underpriced asset or a hidden risk that comps aren't pricing in. Stress-test before assuming the spread holds.
- This rent runs 33% of the median local income ($117k/yr) — at the standard rent-burdened threshold; future hikes will face affordability resistance.
Questions for listing agent
- What do current leases actually rent for vs. the listed asking? Can we see a recent rent roll and the last 12 months of T-12 income?
- It's been on market 57 days. Have you received any prior offers? Is the seller open to a 31% concession, seller financing, or rate buy-down credit?
- What does the HOA fee cover, when was the last increase, and are there any pending special assessments or reserve-fund shortfalls?
- Is there a deadline driving the sale (1031 exchange, divorce, estate, relocation)? That informs how much negotiation room exists.
- Schools are B-rated — typically a magnet for longer-tenancy family renters. What's the average tenant stay here, and is there a school-zone premium baked into asking?
- The area grade is low — what's the realistic commute time and amenity access for the typical tenant pool here? Any planned neighborhood developments (good or bad) we should know about?
- What's the average days-on-market for RENTAL listings here right now (not sales)? A rising rental-DOM trend means longer vacancies and softer asking-rent achievability than the comps imply.
- What's the recent tenant-quality profile in this submarket — average credit score on applications, eviction rate, late-payment / NSF rate, and stable-employment percentage? A property-management company in the area should have these aggregated.
CashFlowRE · CFR-SHKBF38DYND46B
· Data 9 h ago
cashflowre.app · 2026-05-29