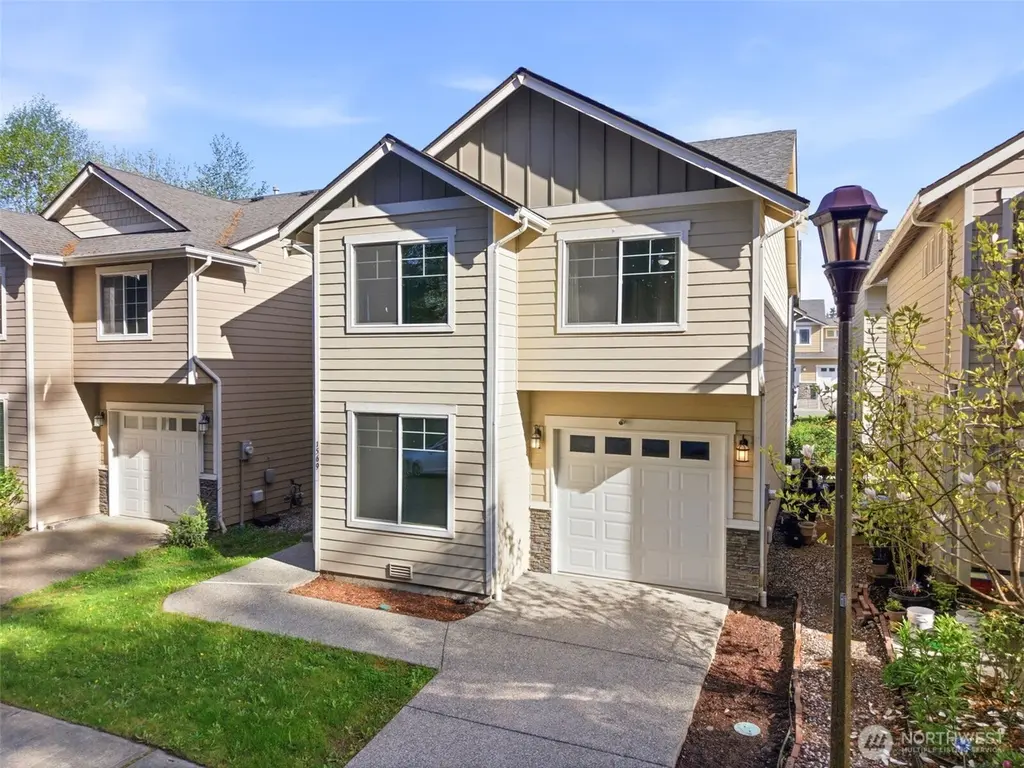
1569 NE Fontaine Way · Poulsbo, WA
Flood risk 1/10 · Minimal
- FEMA flood zone
- X (unshaded)
- Chance of flooding over 30 yrs
- 0.0%
- Est. flood insurance / yr
- $507 – $1,088
Fire risk 1/10 · Minimal
- Est. fire insurance / yr
- $604 – $1,122
Heat risk 3/10 · Minor
- Hot days now (above 85°F)
- 7 days/yr
- Hot days in 30 yrs
- 15 days/yr
Wind risk 1/10 · Minimal
- Chance of severe wind over 30 yrs
- —
Air-quality risk 6/10 · Moderate
- Unhealthy air days now
- 9 days/yr
- Unhealthy air days in 30 yrs
- 9 days/yr
Risk factors via First Street. Map © Google.
Why this score? — see what drove the D grade
The composite is a weighted blend of 9 inputs, each scored 0–100. Each bar is that input's sub-score; the figure is the points it added to the 100-point composite (weight × sub-score).
- ARV discount +13.6/15.0
- Cash flow +8.0/30.0
- Schools +5.4/10.0
- Livability +4.2/5.0
- Rent growth +2.7/5.0
- Condition / age +2.5/5.0
- DSCR +2.1/10.0
- 1% rule +1.9/10.0
- Appreciation +0.0/10.0
$475,000
🖨 Deal sheet (PDF) 📄 Offer letter ✓ Due diligence
Listing remarks
Welcome to your new home in Caldart Heights! Planted directly in the heart of Poulsbo, this spacious 1,628 sqft 4-bed/2.5-bath home + office offers comfort, style & convenience. The open main floor layout is perfect for entertaining, feat a cozy fireplace & newer carpet throughout. The spacious kitchen flows seamlessly into the living & dining areas, creating the ideal gathering space. Upstairs, you’ll find a versatile loft & a private primary suite complete w/ an en-suite bath. Enjoy year-round comfort w/ ductless A/C & the ease of a low-maintenance yard. Built in 2014 w/ durable Hardiplank siding & an attached garage, this home is move-in ready &
Key facts
- 2,178 sq ft lot
- Garage
- Built 2014
Property features AI
Finance
- Other: Bus line nearby (route 344)
- Financial info: Acceptable financing: Cash, Conventional, FHA, State Bond, VA Loan
- HOA & community: Has HOA — $325 annually; HOA covers common area maintenance, lawn service, road maintenance, and snow removal; Community features include CCRs, playground, and trails
Exterior
- Parking: Attached garage; Has garage (garage area ~264 sq ft); Covered parking for 1 vehicle; Driveway and off-street parking
- Security: Security system
- Utilities: Electric energy source; Public water (City of Poulsbo); Sewer connected (City of Poulsbo); Power provided by Puget Sound Energy; Cable connected (Comcast); Internet connected (Xfinity)
- Home design: Single family residence (house); Two stories; Entry at main level; South-facing
- Construction: Built on lot; Effective year built 2014; Cement plank (fiber cement) siding; Composition roof; Poured concrete foundation; Built by Highmark Homes LLC
- Exterior features: Cement planked exterior; Garden space; Cable TV and high-speed internet available; Lot features include alley, curbs, open space, paved surfaces, and sidewalks; Level topography; Has view
Interior
- Kitchen: Kitchen with eating space; Dishwasher; Garbage disposal; Microwave; Refrigerator
- Bedrooms: 4 bedrooms total (all on upper level); Primary bedroom located on second level
- Flooring: Laminate; Vinyl; Carpet
- Bathrooms: 2 full bathrooms; 1 half bathroom; Two bathtubs; Two showers; Half bath on main level
- Heating & cooling: Wall furnace; Has heating; Has cooling
- Interior features: Dining room; Fireplace; Loft; Pantry; Security system; Walk-in closet(s); Water heater
- Laundry & utility: Washer; Dryer; Utility room on second level; Water heater located in garage (electric)
Neighborhood map
What this means for you Summary
Snapshot
- This is a 4-bed/2.5-bath single-family listed at $475k.
Deal economics
- At list price, monthly cash flow is $-486 ($-6k/yr) — negative.
- To cash-flow at today's rent, offer at most $389k (18.1% below list).
- To meet the 1% rule (rent ≥ 1% of price), the offer needs to be $326k (31.4% below list).
- Recommended offer: $326k (31.4% below list) — sets the bar for 1% rule.
- Cap rate 5.1% vs local median 2.7% in Poulsbo — top-decile yield for the area; either an underpriced asset or a hidden risk that comps aren't pricing in. Stress-test before assuming the spread holds.
Location & tenants
- Location reads 85/100 on livability (#30 in WA, #508 nationally) — a professional / high-income tenant draw. Strengths: amenities A+, commute A+, employment A+; Watch: cost of living F.
- North Kitsap School District (suburban): math 53% / reading 65% proficiency, ranked #54 of 291 in WA (top 19%) — acceptable for families but not a draw, mixed tenant base, ~2y average lease.
- Zoned schools: Poulsbo Elementary School (448 students, 26% FRL); Poulsbo Middle School (685 students, 30% FRL); North Kitsap High School (1,063 students, 29% FRL) — zoned schools at 28% FRL track the district average.
- Market conditions: Rents flat; 270 active listings in the ZIP; 2 comparable units currently listed for rent nearby; high-income renter base; 1,294 units permitted in Kitsap County in 2024 (302 in 5+ unit buildings).
- This rent runs 33% of the median local income ($117k/yr) — at the standard rent-burdened threshold; future hikes will face affordability resistance.
Forward outlook
- Local home prices are declining (-3.0%/yr); year-one equity from $3k of loan paydown is wiped out by about $14k of value loss. Plan a longer hold.
- Kitsap County population projected at +8% by 2050 — modest demand growth; plan on rents tracking national, not racing it.
Negotiation context
- It's been on market 57 days — a 3% lower offer ($461k) is reasonable based on typical stale-listing flexibility.
- 2 sale attempts since 3y ago with the ask held roughly flat each time — persistent listings suggest the price (not the market) is what's stuck; bring a comps-based counter.
Questions for the listing agent
- What do current leases actually rent for vs. the listed asking? Can we see a recent rent roll and the last 12 months of T-12 income?
- It's been on market 57 days. Have you received any prior offers? Is the seller open to a 31% concession, seller financing, or rate buy-down credit?
- What does the HOA fee cover, when was the last increase, and are there any pending special assessments or reserve-fund shortfalls?
- Is there a deadline driving the sale (1031 exchange, divorce, estate, relocation)? That informs how much negotiation room exists.
- Schools are B-rated — typically a magnet for longer-tenancy family renters. What's the average tenant stay here, and is there a school-zone premium baked into asking?
- The area grade is low — what's the realistic commute time and amenity access for the typical tenant pool here? Any planned neighborhood developments (good or bad) we should know about?
- What's the average days-on-market for RENTAL listings here right now (not sales)? A rising rental-DOM trend means longer vacancies and softer asking-rent achievability than the comps imply.
- What's the recent tenant-quality profile in this submarket — average credit score on applications, eviction rate, late-payment / NSF rate, and stable-employment percentage? A property-management company in the area should have these aggregated.
- How much new for-sale + rental construction is in the pipeline within 1–3 miles? Heavy new supply typically softens prices + rents 12–24 months out; constrained supply supports both.
Investment metrics
- 1% rule
- 0.69% ✗
- Cap rate
- 5.07%
- Cash-on-cash
- -4.38%
- DSCR
- 0.81
- GRM
- 12.1
CMA / ARV
- ARV (median comp)
- $549,170
- List price
- $475,000
- Delta
- -13.51%
- Verdict
- UNDERPRICED
- Comps
- 20 within 1.0 mi
Show comp detail 12 sales within ~0.75 mi
| Address | Dist | Beds/Ba | Sqft | Sold | Price | $/sf | Match |
|---|---|---|---|---|---|---|---|
| 19766 Garnet Ct NE | 0.20mi | 3/2.0 (-1) | 1,660 (-1%) | 1mo | $650,000 | $392 | 81 |
| 19855 Stavanger Loop NE | 0.22mi | 3/2.5 (-1) | 1,728 (+3%) | 0mo | $565,000 | $327 | 80 |
| 19975 Stavanger Pl NE | 0.30mi | 3/2.5 (-1) | 1,669 (-1%) | 2mo | $582,000 | $349 | 78 |
| 19763 12th Ave NE | 0.27mi | 3/2.0 (-1) | 1,656 (-2%) | 3mo | $635,000 | $383 | 76 |
| 20367 Fortune Pl NE | 0.52mi | 3/2.0 (-1) | 1,706 (+1%) | 1mo | $625,000 | $366 | 66 |
| 19546 23rd Ave NE | 0.51mi | 4/3.0 | 1,722 (+2%) | 6mo | $599,900 | $348 | 65 |
| 2037 NE Ridgewood Dr | 0.32mi | 3/2.5 (-1) | 1,848 (+10%) | 2mo | $555,000 | $300 | 62 |
| 1776 Bungalow Way NE | 0.35mi | 3/3.0 (-1) | 1,850 (+10%) | 2mo | $575,000 | $311 | 58 |
| 1356 Lena Pl NE | 0.55mi | 4/2.5 | 1,930 (+15%) | 0mo | $705,000 | $365 | 49 |
| 2162 NE Kevos Pond Dr | 0.50mi | 3/2.5 (-1) | 1,460 (-13%) | 2mo | $560,000 | $384 | 48 |
| 20165 Bue Rund Loop NE | 0.41mi | 3/2.5 (-1) | 1,917 (+14%) | 6mo | $600,000 | $313 | 47 |
| 2358 NE Adler Ct | 0.65mi | 3/2.5 (-1) | 1,858 (+10%) | 2mo | $606,000 | $326 | 46 |
Match score weights: distance 35% · size 25% · config 20% · recency 20%. Top-matched comps best support the ARV.
Projected returns pro-forma
-3.0% appreciation · 0.71% rent growth · sell at horizon
- IRR
- -26.1%
- Equity multiple
- 0.13×
- Total profit
- $-115,323
- Equity at exit
- $70,824
- IRR
- -31.7%
- Equity multiple
- -0.27×
- Total profit
- $-169,364
- Equity at exit
- $41,069
Cash invested: $133,000 (down + closing). Projections, not guarantees.
Landlord ↔ Tenant lean methodology
- Overall (STATE)
- 28 Tenant-Leaning
- State Washington
- 28 Tenant-Leaning · D+8
- County
- — inherits STATE
- City
- — inherits STATE
ZIP-level market 98370
- Rents YoY
- 0.7%
- Active inventory
- 270
- Price-to-rent
- 12.1×
Monthly cashflow live
- Estimated rent
- $3,258 medium interval (Pro) →
- Mortgage (P&I)
- −$2,491
- Tax from tax record
- −$343 /mo · $4,122/yr
- Insurance
- −$198
- HOA
- −$27
- Vacancy / Maint / Mgmt
- −$684
- Net cashflow
- $-486
Break-even live
Sensitivity live
| Price | -10% $-217 | -5% $-351 | +0% $-486 | +5% $-620 | +10% $-754 |
|---|---|---|---|---|---|
| Rent | -10% $-743 | -5% $-614 | +0% $-486 | +5% $-357 | +10% $-228 |
| Rate | -1.0pp $-246 | -0.5pp $-365 | base $-486 | +0.5pp $-609 | +1.0pp $-734 |
UW: 25.0% down · 7.5% · 30yr · 1.5% tax · 5.0% vac · 8.0% maint · 8.0% mgmt
Financing live
Cash to close
- Down payment
- $118,750
- Closing costs
- $14,250
- Reserves months
- —
- Total cash needed
- —
Loan-product check · same deal, 3 products live
Conventional
25% down · 7.5% · 30yr
- Down + closing
- —
- Monthly P&I
- —
- Monthly cashflow
- —
- DSCR
- —
- Eligible?
- —
Personal DTI + credit; lowest rate.
DSCR
20% down · 8.5% · 30yr
- Down + closing
- —
- Monthly P&I
- —
- Monthly cashflow
- —
- DSCR
- —
- Eligible?
- —
No personal income docs; deal must DSCR.
Hard money
10% down · 12.0% · 12mo
- Down + closing
- —
- Monthly P&I
- —
- Monthly cashflow
- —
- DSCR
- —
- Eligible?
- —
Short-term bridge; refi at stabilization.
Rent comps 2 comps
| Address | Beds | Baths | Sqft | Rent | $/sqft | DOM | Units | Dist |
|---|---|---|---|---|---|---|---|---|
| 2122 NE Hostmark St Poulsbo, WA | 1.0–3.0 | 1.0–1.5 | 920 | $2,801 | $3.04 | 15d | 6 | 0.58mi |
| 20455 1st Ave NE Poulsbo, WA | 1.0–3.0 | 1.0–2.0 | 1015 | $2,917 | $2.87 | 15d | 4 | 1.12mi |
HOA detail
- Monthly dues
- $27 · $324/yr
Listing history 20 events
-
2026-06-22days on market $475,000 Active 57 DOM
-
2026-06-18days on market $475,000 Active 54 DOM
-
2026-06-17days on market $475,000 Active 53 DOM
-
2026-06-16days on market $475,000 Active 52 DOM
-
2026-06-15days on market $475,000 Active 51 DOM
-
2026-06-14days on market $475,000 Active 49 DOM
-
2026-06-13days on market $475,000 Active 48 DOM
-
2026-06-10days on market $475,000 Active 46 DOM
-
2026-06-09days on market $475,000 Active 45 DOM
-
2026-06-09price $475,000 Active 44 DOM
-
2026-06-08days on market $489,000 Active 44 DOM
-
2026-06-07days on market $489,000 Active 43 DOM
-
2026-06-02days on market $489,000 Active 38 DOM
-
2026-06-01days on market $489,000 Active 37 DOM
-
2026-05-31days on market $489,000 Active 36 DOM
-
2026-05-30days on market $489,000 Active 35 DOM
-
2026-04-25$499,000 Active
-
2023-03-20soldstatus $461,000 Closed
-
2023-02-08status Pending
-
2023-01-30$485,000 Active
ⓘ Source: listings_history table (triggers on properties + properties_extension) + one-shot
backfill from property_details.listing_events for pre-trigger history.
Tax reassessment forecast WA · Resets to sale price
- Current annual tax
- $4,122 · $343/mo
- Projected year-2 tax
- $4,655 · $388/mo
- Expected delta
- +$533/yr (+$44/mo · 12.9%)
ⓘ Screening estimate from a state-policy table — verify with the county assessor before closing.
Climate risk First Street
- Flood 1/10 Low FEMA zone X (unshaded) · 0% chance over 30 yrs
- Wildfire 1/10 Low
- Heat 3/10 Moderate 7 d/yr ≥85°F today · 15 d/yr by 30 yrs out
- Wind 1/10 Low
- Air quality 6/10 Major 9 unhealthy d/yr today · 9 by 30 yrs out
Nearby sold comps map
Loading sold comps map…
Walkable amenities ~0.75 mi
Loading nearby amenities…
Taxation est. · year 1
- Rental income
- $39,095
- − Mortgage interest
- −$26,607
- − Property taxes
- −$4,122
- − Insurance
- −$2,375
- − Repairs & maintenance
- −$3,128
- − Management
- −$3,128
- − HOA
- −$324
- − Depreciation
- −$13,818
- Taxable loss
- −$14,406
- Est. tax savings @ 24.0%
- +$3,457
- After-tax cash flow
- $-2,369/yr
For passive investors: Depreciation is non-cash, so a rental often shows a tax loss while cash-flowing — sheltering income. Rental losses are passive: they offset passive income freely, and up to $25,000/yr can offset ordinary (W-2) income if you actively participate and your MAGI is under $100k (phasing out to $0 by $150k); unused losses carry forward. On sale, claimed depreciation is recaptured at up to 25%, and gains may owe capital-gains tax (a 1031 exchange can defer both). Figures are a year-1 estimate at your 24.0% rate — not tax advice; consult a CPA.
Schools (NCES district)
- District
- North Kitsap School District
- NCES district ID
- 5305760
- Math proficiency
- 53% ▼ -1.00%
- Reading proficiency
- 65% ▲ 1.00%
- Median HH income
- $68,919
- Composite
- 53.68/100
- National rank
- #3092
- State rank
- #54 of 291 in WA
Livability — Poulsbo
- Score
- 85/100
- State rank
- #30
- US rank
- #508
Category grades
Schools grade is shown separately in the Schools card above.
Census & demographics
- Census place
- Poulsbo, WA
- County
- Kitsap County · 243,099 people
- City population
- 33,655
- Metro
- Bremerton-Silverdale-Port Orchard, WA
- Population (ZIP)
- 33,655
- Household income
- $116,756
- Rent vs Own
- Severe rent burden
- 904.0
Population outlook (Kitsap County) Hauer SSP2
- Today (2025)
- 277,525 people
- By 2030
- 285,040 · +2.7%
- By 2040
- 294,957 · +6.3%
- By 2050
- 300,622 · +8.3%
- By 2075
- 315,580 · +13.7%
- By 2100
- 304,340 · +9.7%
Race, ethnicity, and origin ACS 2023
- Neighborhood character
- Predominantly White (79%)
- Race & ethnicity
- White 79% Two or more races 11% Hispanic / Latino 9% Asian 3% Black 1%
- Hispanic origin (detail)
- Mexican 5%
- Common ancestry
- Portuguese 7% Italian 4% Slovak 3%
- Foreign-born
- 6% · Canada, South Korea
- Languages at home
- 93% English-only · Spanish 4% Other Indo-European 1% Other Asian/Pacific 1%
Political lean MEDSL · Kitsap
- 2024 margin
- Strong D (+20.9) · D 58.8% · R 37.9% · Other 3.3%
- 2008→2024 swing
- +8.6pp toward D · 2008: 12.3pp · 2024: 20.9pp
- All cycles
- 2024: D+20.9 2020: D+18.1 2016: D+11.6 2012: D+11.1 2008: D+12.3
Not yet ingested
- Civics
- —
Market trends
- HPI YoY
- ▼ -342.47%
- Current HPI
- 347.3427
- Rent YoY
- ▲ 0.71%
- Metro
- Bremerton-Silverdale-Port Orchard, WA
- State GDP YoY
- ▲ 4.65%
- F500 in state
- 22
Industry mix (Fortune 500 HQ in WA)
| Industry | F500 HQs | Revenue |
|---|---|---|
| Retail | 2 | $269B |
|
||
| Technology / Retail | 1 | $638B |
|
||
| Technology | 1 | $245B |
|
||
| Telecommunications | 1 | $38B |
|
||
| Food / Beverage | 1 | $36B |
|
||
| Automotive / Trucks | 1 | $34B |
|
||
Price history
-2.1% since first listed6 events — show timeline
- 2026-06-08 Price Changed $475,000 NWMLS as Distributed by MLS Grid
- 2026-05-19 Price Changed $489,000 NWMLS as Distributed by MLS Grid
- 2026-04-25 Listed $499,000 NWMLS as Distributed by MLS Grid
- 2023-03-20 Sold (MLS) $461,000 NWMLS as Distributed by MLS Grid
- 2023-02-08 Pending — NWMLS as Distributed by MLS Grid
- 2023-01-30 Listed $485,000 NWMLS as Distributed by MLS Grid
Property tax history
+17.8%/yrLatest (2026): $4,122 · +2.4% YoY. Source: county tax records.
Cash-flow waterfall
monthlySold comps — $/sqft
last 12 mo · ≤1 miLoading sold comps…