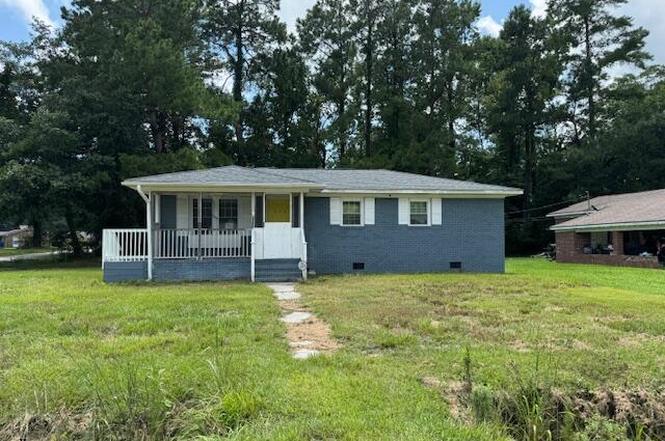
135 Wells Cir
St. Stephen, SC 29479
$195,000D+
3 bd · 1.0 ba ·
1,296 sqft ·
Built 1983
· SingleFamily
· Active
· 345 DOM
Cashflow @ list (25.0% down · 7.5%)
Estimated rent
$1,583/mo
Mortgage (P&I)
−$1,023
Tax + insurance
−$398
HOA
−$0
Vac / Maint / Mgmt
−$332
Net cashflow
$-171/mo
Annual
$-2,048/yr
Cap rate
5.24%
Cash-on-cash
-3.75%
DSCR
0.83
1% rule
0.81%
Cash to close
$54,600
Investor read
- This is a 3-bed/1.0-bath single-family listed at $195k.
- At list price, monthly cash flow is $-171 ($-2k/yr) — negative.
- To cash-flow at today's rent, offer at most $165k (15.5% below list).
- To meet the 1% rule (rent ≥ 1% of price), the offer needs to be $158k (18.8% below list).
- It's been on market 345 days — a 12% lower offer ($172k) is reasonable based on typical stale-listing flexibility.
- Recommended offer: $158k (18.8% below list) — sets the bar for 1% rule.
- In year one you build about $18k of equity ($1k loan paydown + $16k appreciation (8.4% local appreciation)).
- Location reads: area grade D — affects rentability + tenant quality, not the cash-flow math above.
- Berkeley 01 (suburban): math 35% / reading 48% proficiency, ranked #30 of 80 in SC (top 38%) — families likely to look elsewhere, expect single-tenant / working-renter base with shorter leases.
- Zoned schools: St. Stephen Elementary (math 12% / reading 27%, grade F, #499 of 597 statewide, top 84%, 291 students, 100% FRL); St. Stephen Middle (math 2% / reading 22%, grade F, #216 of 229 statewide, top 96%, 209 students, 100% FRL); Timberland High (math 17% / reading 72%, grade F, #166 of 196 statewide, top 87%, 704 students, 100% FRL) — zoned schools average 100% FRL vs 48% district-wide (52 pts higher); higher-poverty schools than district average — tighter screening recommended.
- Zoned-school proficiency averages 25% at this address vs 42% district-wide (-16 pts) — the specific schools serving this property underperform the Berkeley 01 average; the district grade overstates school quality for this exact location.
- Market conditions: 52 active listings in the ZIP; 3,183 units permitted in Berkeley County in 2024 (580 in 5+ unit buildings).
- Berkeley County population projected at +48% by 2050 — long-run rental-demand tailwind backs the buy-and-hold thesis.
- By year 3, paydown + projected appreciation supports a ~$44k cash-out refi (75% LTV) — recoverable capital for the next deal without selling this one.
- Climate carrying-cost: severe wind risk, 80% chance of damaging wind over 30y; extreme-heat days projected 7→17/yr by 2055 (HVAC capex compounding) — expect insurance premiums to compound above CPI over the hold.
Questions for listing agent
- What do current leases actually rent for vs. the listed asking? Can we see a recent rent roll and the last 12 months of T-12 income?
- It's been on market 345 days. Have you received any prior offers? Is the seller open to a 19% concession, seller financing, or rate buy-down credit?
- Why hasn't it sold? Are there any deal-killer items the seller is aware of (foundation, flood, title, zoning, code violations)?
- Is there a deadline driving the sale (1031 exchange, divorce, estate, relocation)? That informs how much negotiation room exists.
- The area grade is low — what's the realistic commute time and amenity access for the typical tenant pool here? Any planned neighborhood developments (good or bad) we should know about?
- What's the average days-on-market for RENTAL listings here right now (not sales)? A rising rental-DOM trend means longer vacancies and softer asking-rent achievability than the comps imply.
- What's the recent tenant-quality profile in this submarket — average credit score on applications, eviction rate, late-payment / NSF rate, and stable-employment percentage? A property-management company in the area should have these aggregated.
- How much new for-sale + rental construction is in the pipeline within 1–3 miles? Heavy new supply typically softens prices + rents 12–24 months out; constrained supply supports both.
CashFlowRE · CFR-SJ67JQ2ZHRK3Q8
· Data 1 day ago
cashflowre.app · 2026-05-29