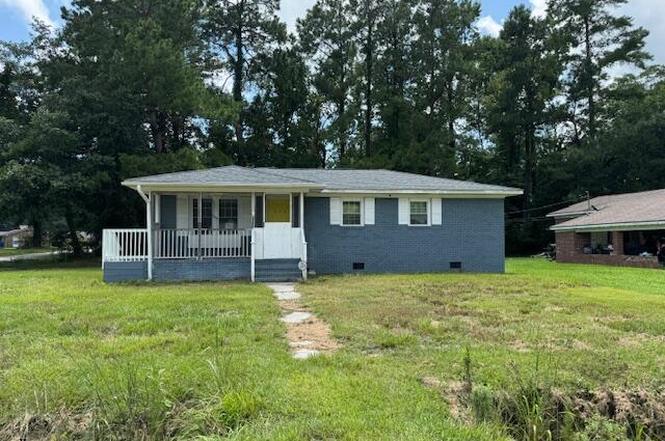
135 Wells Cir · St. Stephen, SC
Flood risk 1/10 · Minimal
- FEMA flood zone
- X (unshaded)
- Chance of flooding over 30 yrs
- 0.0%
- Est. flood insurance / yr
- $507 – $1,088
Fire risk 4/10 · Minor
- Est. fire insurance / yr
- $783 – $1,453
Heat risk 8/10 · Major
- Hot days now (above 110°F)
- 7 days/yr
- Hot days in 30 yrs
- 17 days/yr
Wind risk 8/10 · Major
- Chance of severe wind over 30 yrs
- 80.0%
Air-quality risk 4/10 · Minor
- Unhealthy air days now
- 5 days/yr
- Unhealthy air days in 30 yrs
- 5 days/yr
Risk factors via First Street. Map © Google.
Why this score? — see what drove the D+ grade
The composite is a weighted blend of 9 inputs, each scored 0–100. Each bar is that input's sub-score; the figure is the points it added to the 100-point composite (weight × sub-score).
- ARV discount +15.0/15.0
- Appreciation +9.2/10.0
- Cash flow +8.5/30.0
- Schools +3.6/10.0
- 1% rule +3.1/10.0
- Rent growth +2.5/5.0
- Livability +2.5/5.0
- Condition / age +2.5/5.0
- DSCR +2.3/10.0
$195,000
🖨 Deal sheet (PDF) 📄 Offer letter ✓ Due diligence
Listing remarks
Great investment property in St. Stephen! This three bedroom, one bath home is situated on a nice size lot. It features a living room, kitchen with an attached dining area, 3 bedrooms, 1 full bath, laundry hook-ups, a bonus space, and a large storage closet. This home was recently remodeled. With a little TLC from the next owner, it could be brought back to life.
Key facts
- Nice size lot
- Large storage closet
- Living room
Tags
Property features AI
Exterior
- Utilities: Public sewer
- Home design: Single family detached home; One story; Ground-level entry; Located in Curriboo Heights subdivision; Level lot under 0.5 acre
- Exterior features: Architectural roof
Interior
- Kitchen: Dishwasher; Electric oven
- Bedrooms: 3 bedrooms; Master bedroom with ceiling fan
- Flooring: Ceramic tile; Laminate
- Bathrooms: 1 bathroom
- Heating & cooling: Central air conditioning; Electric heating
- Interior features: Smooth ceilings; Ceiling fans; Eat-in kitchen; Formal living area; Utility space
- Laundry & utility: Laundry room; Washer hookup; Electric dryer hookup
Neighborhood map
What this means for you Summary
Snapshot
- This is a 3-bed/1.0-bath single-family listed at $195k.
Deal economics
- At list price, monthly cash flow is $-171 ($-2k/yr) — negative.
- To cash-flow at today's rent, offer at most $165k (15.5% below list).
- To meet the 1% rule (rent ≥ 1% of price), the offer needs to be $158k (18.8% below list).
- Recommended offer: $158k (18.8% below list) — sets the bar for 1% rule.
Location & tenants
- Location reads: area grade D — affects rentability + tenant quality, not the cash-flow math above.
- Berkeley 01 (suburban): math 35% / reading 48% proficiency, ranked #30 of 80 in SC (top 38%) — families likely to look elsewhere, expect single-tenant / working-renter base with shorter leases.
- Zoned schools: St. Stephen Elementary (math 12% / reading 27%, grade F, #499 of 597 statewide, top 84%, 291 students, 100% FRL); St. Stephen Middle (math 2% / reading 22%, grade F, #216 of 229 statewide, top 96%, 209 students, 100% FRL); Timberland High (math 17% / reading 72%, grade F, #166 of 196 statewide, top 87%, 704 students, 100% FRL) — zoned schools average 100% FRL vs 48% district-wide (52 pts higher); higher-poverty schools than district average — tighter screening recommended.
- Zoned-school proficiency averages 25% at this address vs 42% district-wide (-16 pts) — the specific schools serving this property underperform the Berkeley 01 average; the district grade overstates school quality for this exact location.
- Market conditions: 52 active listings in the ZIP; 3,183 units permitted in Berkeley County in 2024 (580 in 5+ unit buildings).
Forward outlook
- In year one you build about $18k of equity ($1k loan paydown + $16k appreciation (8.4% local appreciation)).
- Berkeley County population projected at +48% by 2050 — long-run rental-demand tailwind backs the buy-and-hold thesis.
- By year 3, paydown + projected appreciation supports a ~$44k cash-out refi (75% LTV) — recoverable capital for the next deal without selling this one.
Negotiation context
- It's been on market 345 days — a 12% lower offer ($172k) is reasonable based on typical stale-listing flexibility.
Risks & watch-outs
- Climate carrying-cost: severe wind risk, 80% chance of damaging wind over 30y; extreme-heat days projected 7→17/yr by 2055 (HVAC capex compounding) — expect insurance premiums to compound above CPI over the hold.
Questions for the listing agent
- What do current leases actually rent for vs. the listed asking? Can we see a recent rent roll and the last 12 months of T-12 income?
- It's been on market 345 days. Have you received any prior offers? Is the seller open to a 19% concession, seller financing, or rate buy-down credit?
- Why hasn't it sold? Are there any deal-killer items the seller is aware of (foundation, flood, title, zoning, code violations)?
- Is there a deadline driving the sale (1031 exchange, divorce, estate, relocation)? That informs how much negotiation room exists.
- The area grade is low — what's the realistic commute time and amenity access for the typical tenant pool here? Any planned neighborhood developments (good or bad) we should know about?
- What's the average days-on-market for RENTAL listings here right now (not sales)? A rising rental-DOM trend means longer vacancies and softer asking-rent achievability than the comps imply.
- What's the recent tenant-quality profile in this submarket — average credit score on applications, eviction rate, late-payment / NSF rate, and stable-employment percentage? A property-management company in the area should have these aggregated.
- How much new for-sale + rental construction is in the pipeline within 1–3 miles? Heavy new supply typically softens prices + rents 12–24 months out; constrained supply supports both.
Investment metrics
- 1% rule
- 0.81% ✗
- Cap rate
- 5.24%
- Cash-on-cash
- -3.75%
- DSCR
- 0.83
- GRM
- 10.3
CMA / ARV
- ARV (on-the-fly)
- $273,456
- Comps found
- 2
Show comp detail 2 sales within ~0.75 mi
| Address | Dist | Beds/Ba | Sqft | Sold | Price | $/sf | Match |
|---|---|---|---|---|---|---|---|
| 105 Gourdin St | 0.61mi | 4/2.0 (+1) | 1,248 (-4%) | 4mo | $228,000 | $183 | 53 |
| 1106 Graham St | 0.54mi | 3/2.0 | 1,470 (+13%) | 4mo | $310,000 | $211 | 45 |
Match score weights: distance 35% · size 25% · config 20% · recency 20%. Top-matched comps best support the ARV.
Projected returns pro-forma
8.39% appreciation · 3.0% rent growth · sell at horizon
- IRR
- 18.1%
- Equity multiple
- 2.36×
- Total profit
- $74,365
- Equity at exit
- $153,293
- IRR
- 17.0%
- Equity multiple
- 5.11×
- Total profit
- $224,282
- Equity at exit
- $309,327
Cash invested: $54,600 (down + closing). Projections, not guarantees.
Landlord ↔ Tenant lean methodology
- Overall (STATE)
- 90 Strongly Landlord-Friendly
- State South Carolina
- 90 Strongly Landlord-Friendly · R+6
- County
- — inherits STATE
- City
- — inherits STATE
ZIP-level market 29479
- Home prices YoY
- 2.6%
- Active inventory
- 52
- Price-to-rent
- 10.3×
Monthly cashflow live
- Estimated rent
- $1,583 medium interval (Pro) →
- Mortgage (P&I)
- −$1,023
- Tax from tax record
- −$317 /mo · $3,805/yr
- Insurance
- −$81
- HOA
- −$0
- Vacancy / Maint / Mgmt
- −$332
- Net cashflow
- $-171
Break-even live
Sensitivity live
| Price | -10% $-60 | -5% $-115 | +0% $-171 | +5% $-226 | +10% $-281 |
|---|---|---|---|---|---|
| Rent | -10% $-296 | -5% $-233 | +0% $-171 | +5% $-108 | +10% $-46 |
| Rate | -1.0pp $-72 | -0.5pp $-121 | base $-171 | +0.5pp $-221 | +1.0pp $-273 |
UW: 25.0% down · 7.5% · 30yr · 1.5% tax · 5.0% vac · 8.0% maint · 8.0% mgmt
Financing live
Cash to close
- Down payment
- $48,750
- Closing costs
- $5,850
- Reserves months
- —
- Total cash needed
- —
Loan-product check · same deal, 3 products live
Conventional
25% down · 7.5% · 30yr
- Down + closing
- —
- Monthly P&I
- —
- Monthly cashflow
- —
- DSCR
- —
- Eligible?
- —
Personal DTI + credit; lowest rate.
DSCR
20% down · 8.5% · 30yr
- Down + closing
- —
- Monthly P&I
- —
- Monthly cashflow
- —
- DSCR
- —
- Eligible?
- —
No personal income docs; deal must DSCR.
Hard money
10% down · 12.0% · 12mo
- Down + closing
- —
- Monthly P&I
- —
- Monthly cashflow
- —
- DSCR
- —
- Eligible?
- —
Short-term bridge; refi at stabilization.
Listing history 23 events
-
2026-06-21days on market $195,000 Active 345 DOM
-
2026-06-18days on market $195,000 Active 342 DOM
-
2026-06-17days on market $195,000 Active 341 DOM
-
2026-06-16days on market $195,000 Active 340 DOM
-
2026-06-15days on market $195,000 Active 339 DOM
-
2026-06-13days on market $195,000 Active 337 DOM
-
2026-06-13days on market $195,000 Active 336 DOM
-
2026-06-10days on market $195,000 Active 334 DOM
-
2026-06-09days on market $195,000 Active 333 DOM
-
2026-06-08days on market $195,000 Active 332 DOM
-
2026-06-07days on market $195,000 Active 331 DOM
-
2026-06-05days on market $195,000 Active 328 DOM
-
2026-06-03days on market $195,000 Active 327 DOM
-
2026-06-03days on market $195,000 Active 326 DOM
-
2026-06-01days on market $195,000 Active 325 DOM
-
2026-05-31days on market $195,000 Active 324 DOM
-
2026-05-13price $195,000
-
2026-01-15price $205,000
-
2025-12-08price $215,000
-
2025-09-24price $220,500
-
2025-07-11$225,000 Active
-
2023-06-26soldstatus $223,900
-
2023-02-15soldstatus $72,000
ⓘ Source: listings_history table (triggers on properties + properties_extension) + one-shot
backfill from property_details.listing_events for pre-trigger history.
Tax reassessment forecast SC · Resets to sale price
- Current annual tax
- $3,805 · $317/mo
- Projected year-2 tax
- $3,805 · $317/mo
- Expected delta
- $0/yr ($0/mo · 0.0%)
ⓘ Screening estimate from a state-policy table — verify with the county assessor before closing.
Climate risk First Street
- Flood 1/10 Low FEMA zone X (unshaded) · 0% chance over 30 yrs
- Wildfire 4/10 Moderate
- Heat 8/10 Severe 7 d/yr ≥110°F today · 17 d/yr by 30 yrs out
- Wind 8/10 Severe 80% chance of damaging wind over 30 yrs
- Air quality 4/10 Moderate 5 unhealthy d/yr today · 5 by 30 yrs out
Nearby sold comps map
Loading sold comps map…
Walkable amenities ~0.75 mi
Loading nearby amenities…
Taxation est. · year 1
- Rental income
- $18,992
- − Mortgage interest
- −$10,923
- − Property taxes
- −$3,805
- − Insurance
- −$975
- − Repairs & maintenance
- −$1,519
- − Management
- −$1,519
- − Depreciation
- −$5,673
- Taxable loss
- −$5,423
- Est. tax savings @ 24.0%
- +$1,302
- After-tax cash flow
- $-746/yr
For passive investors: Depreciation is non-cash, so a rental often shows a tax loss while cash-flowing — sheltering income. Rental losses are passive: they offset passive income freely, and up to $25,000/yr can offset ordinary (W-2) income if you actively participate and your MAGI is under $100k (phasing out to $0 by $150k); unused losses carry forward. On sale, claimed depreciation is recaptured at up to 25%, and gains may owe capital-gains tax (a 1031 exchange can defer both). Figures are a year-1 estimate at your 24.0% rate — not tax advice; consult a CPA.
Schools (NCES district)
- District
- Berkeley 01
- NCES district ID
- 4501170
- Math proficiency
- 35% ▼ -8.00%
- Reading proficiency
- 48% ▼ -2.00%
- Median HH income
- $52,724
- Composite
- 35.95/100
- National rank
- #4799
- State rank
- #30 of 80 in SC
Livability — St. Stephen
No livability data for this city. (Only ~50 U.S. cities are tracked.)
Census & demographics
- Census place
- St. Stephen, SC
- Population (ZIP)
- 6,287
Population outlook (Berkeley County) Hauer SSP2
- Today (2025)
- 254,184 people
- By 2030
- 279,677 · +10.0%
- By 2040
- 329,379 · +29.6%
- By 2050
- 375,557 · +47.8%
- By 2075
- 476,740 · +87.6%
- By 2100
- 535,945 · +110.8%
Race, ethnicity, and origin ACS 2023
- Neighborhood character
- Diverse neighborhood (Simpson 0.61)
- Race & ethnicity
- Black 45% White 42% Hispanic / Latino 11% Two or more races 2%
- Hispanic origin (detail)
- Mexican 3% Puerto Rican 3%
- Common ancestry
- Italian 1% Slovak 1% Serbian 1%
- Foreign-born
- 1% · Canada
- Languages at home
- 91% English-only · Spanish 8%
Political lean MEDSL · Berkeley
- 2024 margin
- R (+16.3) · D 41.1% · R 57.4% · Other 1.4%
- 2008→2024 swing
- -3.2pp toward R · 2008: -13.1pp · 2024: -16.3pp
- All cycles
- 2024: R+16.3 2020: R+11.7 2016: R+17.4 2012: R+18.9 2008: R+13.1
Not yet ingested
- Civics
- —
Market trends
- HPI YoY
- ▲ 8.39%
- Current HPI
- 333.0749
- Rent YoY
- —
- Metro
- —
- State GDP YoY
- ▲ 4.51%
- F500 in state
- 2
Industry mix (Fortune 500 HQ in SC)
| Industry | F500 HQs | Revenue |
|---|---|---|
| Packaging | 1 | $7B |
|
||
Price history
+170.8% since first listed7 events — show timeline
- 2026-05-13 Price Changed $195,000 Charleston Trident MLS
- 2026-01-15 Price Changed $205,000 Charleston Trident MLS
- 2025-12-08 Price Changed $215,000 Charleston Trident MLS
- 2025-09-24 Price Changed $220,500 Charleston Trident MLS
- 2025-07-11 Listed $225,000 Charleston Trident MLS
- 2023-06-26 Sold (Public Records) $223,900 Public Records
- 2023-02-15 Sold (Public Records) $72,000 Public Records
Property tax history
+43.6%/yrLatest (2025): $3,805 · +190.0% YoY. Source: county tax records.
Cash-flow waterfall
monthlySold comps — $/sqft
last 12 mo · ≤1 miLoading sold comps…