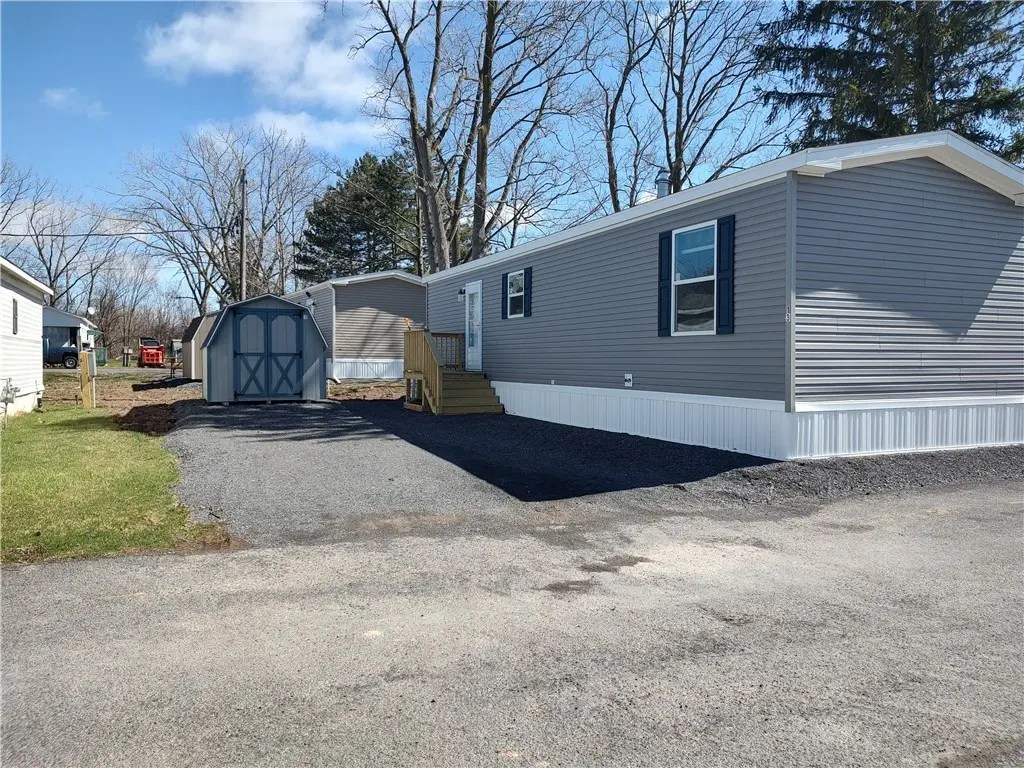
13 Birch Dr
Auburn, NY 13021
$73,800B-
1 bd · 1.0 ba ·
680 sqft ·
Built 2026
· Manufactured
· Active
· 82 DOM
Cashflow @ list (25.0% down · 7.5%)
Estimated rent
$928/mo
Mortgage (P&I)
−$387
Tax + insurance
−$123
HOA
−$0
Vac / Maint / Mgmt
−$195
Net cashflow
$223/mo
Annual
$2,673/yr
Cap rate
9.91%
Cash-on-cash
12.93%
DSCR
1.58
1% rule
1.26%
Cash to close
$20,664
Investor read
- This is a 1-bed/1.0-bath manufactured listed at $74k. Condition is rated good.
- At list price, monthly cash flow is $223 ($3k/yr) — positive.
- The deal already cash-flows at list — no discount required.
- Meets the 1% rule at list price ($928 rent vs $74k).
- It's been on market 82 days — a 6% lower offer ($69k) is reasonable based on typical stale-listing flexibility.
- Recommended offer: $69k (6.0% below list) — sets the bar for market timing.
- Local home prices are declining (-3.0%/yr); year-one equity from $510 of loan paydown is wiped out by about $2k of value loss. Plan a longer hold.
- Location reads 74/100 on livability (#298 in NY, #4,814 nationally) — a middle-class / working-renter tenant base. Strengths: cost of living A+, housing A+, health & safety A+; Watch: amenities D-, commute F, employment D-.
- Union Springs Central School District (rural): math 59% / reading 63% proficiency, ranked #220 of 590 in NY (top 37%) — acceptable for families but not a draw, mixed tenant base, ~2y average lease.
- Zoned schools: Andrew J Smith Elementary School (math 57% / reading 62%, grade B-, #745 of 2,108 statewide, top 39%, 339 students, 41% FRL); Andrew J Smith Elementary School (math 57% / reading 62%, grade B-, #745 of 2,108 statewide, top 39%, 339 students, 41% FRL); Union Springs High School (math 95% / reading 90%, grade A+, #153 of 1,100 statewide, top 14%, 233 students, 34% FRL).
- Market conditions: 225 active listings in the ZIP; 161 units permitted in Cayuga County in 2024 (65 in 5+ unit buildings).
- Cayuga County population projected at -18% by 2050 — secular population decline; favor cash flow + early exit over multi-decade hold.
- At projected returns (-3.0% appreciation + 3.0% rent growth), your $21k cash investment doubles in ~9 years — after that, you're playing with house money.
- Cap rate 9.9% vs local median 7.6% in Auburn — top-decile yield for the area; either an underpriced asset or a hidden risk that comps aren't pricing in. Stress-test before assuming the spread holds.
Questions for listing agent
- It's been on market 82 days. Have you received any prior offers? Is the seller open to a 6% concession, seller financing, or rate buy-down credit?
- Why hasn't it sold? Are there any deal-killer items the seller is aware of (foundation, flood, title, zoning, code violations)?
- Is there a deadline driving the sale (1031 exchange, divorce, estate, relocation)? That informs how much negotiation room exists.
- Schools are D-rated, which usually means shorter tenancies and higher turnover. Who's the typical renter profile here, and what's been the actual vacancy rate?
- What's the average days-on-market for RENTAL listings here right now (not sales)? A rising rental-DOM trend means longer vacancies and softer asking-rent achievability than the comps imply.
- What's the recent tenant-quality profile in this submarket — average credit score on applications, eviction rate, late-payment / NSF rate, and stable-employment percentage? A property-management company in the area should have these aggregated.
- How much new for-sale + rental construction is in the pipeline within 1–3 miles? Heavy new supply typically softens prices + rents 12–24 months out; constrained supply supports both.
CashFlowRE · CFR-SKG0NXEP69MW6Q
· Data 13 h ago
cashflowre.app · 2026-05-29