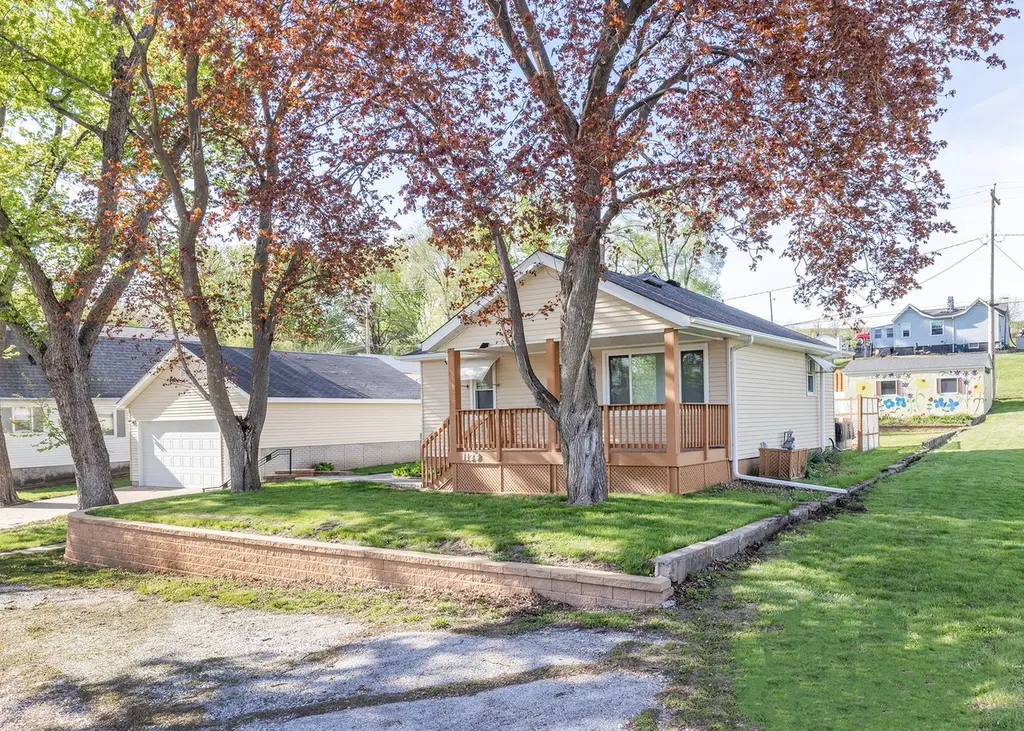
1124 Walnut St
Buffalo, IA 52728
$140,000D-
2 bd · 1.0 ba ·
714 sqft ·
Built 1956
· SingleFamily
· Pending
· 6 DOM
Cashflow @ list (25.0% down · 7.5%)
Estimated rent
$1,115/mo
Mortgage (P&I)
−$734
Tax + insurance
−$211
HOA
−$0
Vac / Maint / Mgmt
−$234
Net cashflow
$-65/mo
Annual
$-779/yr
Cap rate
5.74%
Cash-on-cash
-1.99%
DSCR
0.91
1% rule
0.80%
Cash to close
$39,200
Investor read
- This is a 2-bed/1.0-bath single-family listed at $140k.
- At list price, monthly cash flow is $-65 ($-779/yr) — negative.
- To cash-flow at today's rent, offer at most $129k (8.2% below list).
- To meet the 1% rule (rent ≥ 1% of price), the offer needs to be $111k (20.4% below list).
- Only 6 days on market — expect competitive offers; lowballing is unlikely to land.
- Recommended offer: $111k (20.4% below list) — sets the bar for 1% rule.
- In year one you build about $3k of equity ($968 loan paydown + $2k appreciation (1.5% local appreciation)).
- Location reads 72/100 on livability (#317 in IA) — a middle-class / working-renter tenant base. Strengths: crime A+, cost of living A+, housing A+; Watch: amenities F, commute F, health & safety F.
- Davenport Community School District (urban): math 43% / reading 50% proficiency, ranked #288 of 289 in IA (top 100%) — families likely to look elsewhere, expect single-tenant / working-renter base with shorter leases.
- Zoned schools: Buffalo Elementary School (math 62% / reading 57%, grade B-, #390 of 616 statewide, top 69%, 298 students, 48% FRL); Walcott Intermediate (math 58% / reading 59%, grade B, #194 of 246 statewide, top 79%, 204 students, 48% FRL); West High School (math 38% / reading 53%, grade D-, #323 of 336 statewide, top 96%, 1,469 students, 54% FRL).
- Watch-outs: built in 1956 — expect roof / HVAC / electrical / plumbing capex.
- Market conditions: 4 active listings in the ZIP; 805 units permitted in Scott County in 2024 (479 in 5+ unit buildings).
- Scott County population projected at +19% by 2050 — long-run rental-demand tailwind backs the buy-and-hold thesis.
- 2 sale attempts with the ask held roughly flat each time — persistent listings suggest the price (not the market) is what's stuck; bring a comps-based counter.
- At projected returns (1.5% appreciation + 3.0% rent growth), your $39k cash investment doubles in ~10 years — after that, you're playing with house money.
- By year 10, paydown + projected appreciation supports a ~$31k cash-out refi (75% LTV) — recoverable capital for the next deal without selling this one.
Questions for listing agent
- What do current leases actually rent for vs. the listed asking? Can we see a recent rent roll and the last 12 months of T-12 income?
- Built in 1956 — when were the roof, HVAC, electrical panel, plumbing, and water heater last replaced?
- Is there a deadline driving the sale (1031 exchange, divorce, estate, relocation)? That informs how much negotiation room exists.
- Schools are B-rated — typically a magnet for longer-tenancy family renters. What's the average tenant stay here, and is there a school-zone premium baked into asking?
- The area grade is low — what's the realistic commute time and amenity access for the typical tenant pool here? Any planned neighborhood developments (good or bad) we should know about?
- What's the average days-on-market for RENTAL listings here right now (not sales)? A rising rental-DOM trend means longer vacancies and softer asking-rent achievability than the comps imply.
- What's the recent tenant-quality profile in this submarket — average credit score on applications, eviction rate, late-payment / NSF rate, and stable-employment percentage? A property-management company in the area should have these aggregated.
- How much new for-sale + rental construction is in the pipeline within 1–3 miles? Heavy new supply typically softens prices + rents 12–24 months out; constrained supply supports both.
CashFlowRE · CFR-SNY0PM5H92BXNG
· Data 4 weeks ago
cashflowre.app · 2026-05-29