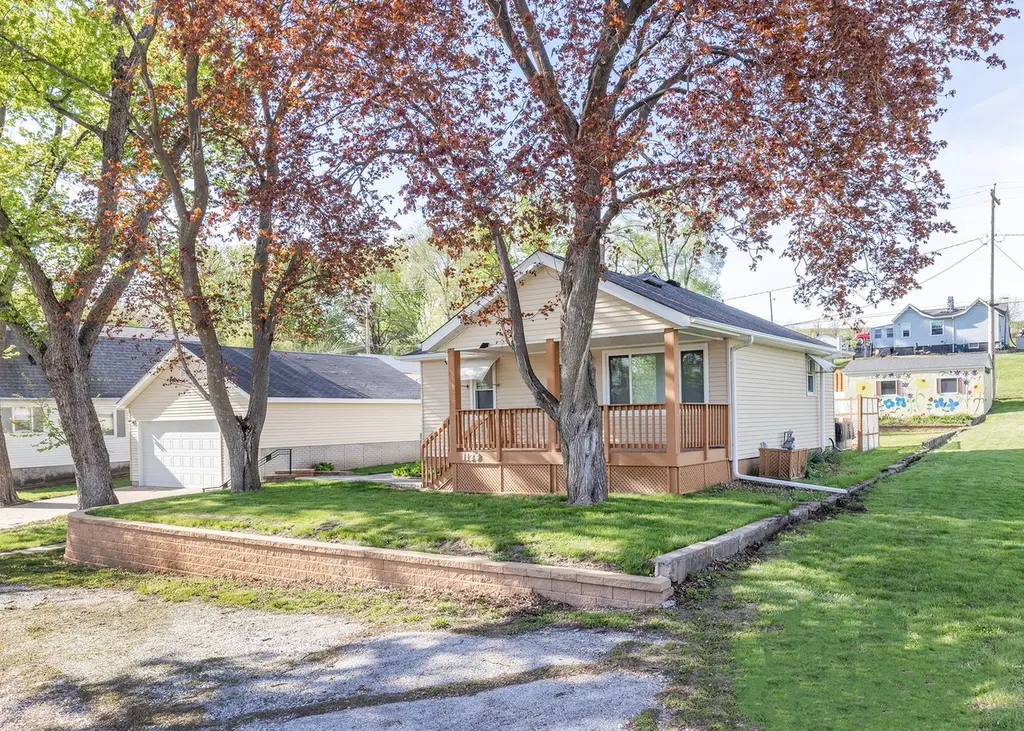
1124 Walnut St · Buffalo, IA
Flood risk 1/10 · Minimal
- FEMA flood zone
- X (unshaded)
- Chance of flooding over 30 yrs
- 0.0%
- Est. flood insurance / yr
- $473 – $860
Fire risk 2/10 · Minimal
- Est. fire insurance / yr
- $902 – $1,676
Heat risk 3/10 · Minor
- Hot days now (above 104°F)
- 7 days/yr
- Hot days in 30 yrs
- 16 days/yr
Wind risk 2/10 · Minimal
- Chance of severe wind over 30 yrs
- —
Air-quality risk 3/10 · Minor
- Unhealthy air days now
- 2 days/yr
- Unhealthy air days in 30 yrs
- 3 days/yr
Risk factors via First Street. Map © Google.
Why this score? — see what drove the D- grade
The composite is a weighted blend of 9 inputs, each scored 0–100. Each bar is that input's sub-score; the figure is the points it added to the 100-point composite (weight × sub-score).
- Cash flow +10.8/30.0
- Appreciation +5.8/10.0
- Schools +3.9/10.0
- Livability +3.6/5.0
- DSCR +3.1/10.0
- 1% rule +3.0/10.0
- Rent growth +2.5/5.0
- Condition / age +2.5/5.0
- ARV discount +0.0/15.0
$140,000
🖨 Deal sheet (PDF) 📄 Offer letter ✓ Due diligence
Listing remarks
The Garages & yard will have you in love as soon as you pull up to this well cared for home. The retaining wall and yard are like being in your own garden with 250 Tulips according to the owners. This 2 bedroom 1 bath home has a butifull front porch to welcome you in. You will notice the 2 car garage with loft storage and power right away and out back you will find a 1 car garage and an oversized block shed! Inside you will enjoy the opened up look of the hallway and realize the potential of the kitchen. With an unfinished basement the possibilites are limitless. Once you walk outside the back door you are greated by a Hot Tube and 2 apple trees! Come see this one!
Key facts
- Hot tub
- Front porch
- Unfinished basement
Tags
Property features AI
Finance
- Other: Property is fee simple ownership
- HOA & community: No master association fee required
Exterior
- Parking: Detached garage with 3 garage spaces (3 parking spaces total)
- Utilities: Public water; Public sewer
- Home design: Detached single-family home; One-story
- Construction: Built approximately 61–70 years ago; Vinyl siding; Asphalt roof; Block foundation
- Exterior features: Partial fencing; Garden and sloped lot
Interior
- Kitchen: Ceramic tile flooring in kitchen; Microwave
- Bedrooms: Two bedrooms (both on the main level); Master bedroom on the main level
- Flooring: Luxury vinyl flooring in living room and bedrooms; Ceramic tile in kitchen; Other flooring in basement laundry
- Bathrooms: One full bathroom
- Heating & cooling: Natural gas heating; Central air conditioning
- Interior features: Four total rooms; Unfinished full basement
- Laundry & utility: Laundry room in basement (8 x 10)
Neighborhood map
What this means for you Summary
Snapshot
- This is a 2-bed/1.0-bath single-family listed at $140k.
Deal economics
- At list price, monthly cash flow is $-65 ($-779/yr) — negative.
- To cash-flow at today's rent, offer at most $129k (8.2% below list).
- To meet the 1% rule (rent ≥ 1% of price), the offer needs to be $111k (20.4% below list).
- Recommended offer: $111k (20.4% below list) — sets the bar for 1% rule.
Location & tenants
- Location reads 72/100 on livability (#317 in IA) — a middle-class / working-renter tenant base. Strengths: crime A+, cost of living A+, housing A+; Watch: amenities F, commute F, health & safety F.
- Davenport Community School District (urban): math 43% / reading 50% proficiency, ranked #288 of 289 in IA (top 100%) — families likely to look elsewhere, expect single-tenant / working-renter base with shorter leases.
- Zoned schools: Buffalo Elementary School (math 62% / reading 57%, grade B-, #390 of 616 statewide, top 69%, 298 students, 48% FRL); Walcott Intermediate (math 58% / reading 59%, grade B, #194 of 246 statewide, top 79%, 204 students, 48% FRL); West High School (math 38% / reading 53%, grade D-, #323 of 336 statewide, top 96%, 1,469 students, 54% FRL).
- Market conditions: 4 active listings in the ZIP; 805 units permitted in Scott County in 2024 (479 in 5+ unit buildings).
Forward outlook
- In year one you build about $3k of equity ($968 loan paydown + $2k appreciation (1.5% local appreciation)).
- Scott County population projected at +19% by 2050 — long-run rental-demand tailwind backs the buy-and-hold thesis.
- At projected returns (1.5% appreciation + 3.0% rent growth), your $39k cash investment doubles in ~10 years — after that, you're playing with house money.
- By year 10, paydown + projected appreciation supports a ~$31k cash-out refi (75% LTV) — recoverable capital for the next deal without selling this one.
Negotiation context
- Only 6 days on market — expect competitive offers; lowballing is unlikely to land.
- 2 sale attempts with the ask held roughly flat each time — persistent listings suggest the price (not the market) is what's stuck; bring a comps-based counter.
Risks & watch-outs
- Watch-outs: built in 1956 — expect roof / HVAC / electrical / plumbing capex.
Questions for the listing agent
- What do current leases actually rent for vs. the listed asking? Can we see a recent rent roll and the last 12 months of T-12 income?
- Built in 1956 — when were the roof, HVAC, electrical panel, plumbing, and water heater last replaced?
- Is there a deadline driving the sale (1031 exchange, divorce, estate, relocation)? That informs how much negotiation room exists.
- Schools are B-rated — typically a magnet for longer-tenancy family renters. What's the average tenant stay here, and is there a school-zone premium baked into asking?
- The area grade is low — what's the realistic commute time and amenity access for the typical tenant pool here? Any planned neighborhood developments (good or bad) we should know about?
- What's the average days-on-market for RENTAL listings here right now (not sales)? A rising rental-DOM trend means longer vacancies and softer asking-rent achievability than the comps imply.
- What's the recent tenant-quality profile in this submarket — average credit score on applications, eviction rate, late-payment / NSF rate, and stable-employment percentage? A property-management company in the area should have these aggregated.
- How much new for-sale + rental construction is in the pipeline within 1–3 miles? Heavy new supply typically softens prices + rents 12–24 months out; constrained supply supports both.
Investment metrics
- 1% rule
- 0.80% ✗
- Cap rate
- 5.74%
- Cash-on-cash
- -1.99%
- DSCR
- 0.91
- GRM
- 10.5
CMA / ARV
- ARV (on-the-fly)
- $113,526
- Comps found
- 4
Show comp detail 4 sales within ~0.75 mi
| Address | Dist | Beds/Ba | Sqft | Sold | Price | $/sf | Match |
|---|---|---|---|---|---|---|---|
| 1124 Walnut St | 0.00mi | 2/1.0 | 714 (0%) | 1mo | $157,000 | $220 | 99 |
| 1117 Chestnut St | 0.10mi | 2/1.0 | 710 (-1%) | 15mo | $113,000 | $159 | 82 |
| 708 3rd St | 0.35mi | 2/1.0 | 711 (-0%) | 10mo | $46,200 | $65 | 75 |
| 1119 Chestnut St | 0.10mi | 2/1.0 | 808 (+13%) | 23mo | $42,500 | $53 | 54 |
Match score weights: distance 35% · size 25% · config 20% · recency 20%. Top-matched comps best support the ARV.
Projected returns pro-forma
1.54% appreciation · 3.0% rent growth · sell at horizon
- IRR
- 1.1%
- Equity multiple
- 1.06×
- Total profit
- $2,257
- Equity at exit
- $51,803
- IRR
- 5.4%
- Equity multiple
- 1.71×
- Total profit
- $27,696
- Equity at exit
- $72,056
Cash invested: $39,200 (down + closing). Projections, not guarantees.
Landlord ↔ Tenant lean methodology
- Overall (STATE)
- 83 Strongly Landlord-Friendly
- State Iowa
- 83 Strongly Landlord-Friendly · R+6
- County
- — inherits STATE
- City
- — inherits STATE
ZIP-level market 52728
- Home prices YoY
- 0.8%
- Active inventory
- 4
- Price-to-rent
- 10.5×
Monthly cashflow live
- Estimated rent
- $1,115 medium interval (Pro) →
- Mortgage (P&I)
- −$734
- Tax from tax record
- −$153 /mo · $1,836/yr
- Insurance
- −$58
- HOA
- −$0
- Vacancy / Maint / Mgmt
- −$234
- Net cashflow
- $-65
Break-even live
Sensitivity live
| Price | -10% $14 | -5% $-25 | +0% $-65 | +5% $-105 | +10% $-144 |
|---|---|---|---|---|---|
| Rent | -10% $-153 | -5% $-109 | +0% $-65 | +5% $-21 | +10% $23 |
| Rate | -1.0pp $6 | -0.5pp $-29 | base $-65 | +0.5pp $-101 | +1.0pp $-138 |
UW: 25.0% down · 7.5% · 30yr · 1.5% tax · 5.0% vac · 8.0% maint · 8.0% mgmt
Financing live
Cash to close
- Down payment
- $35,000
- Closing costs
- $4,200
- Reserves months
- —
- Total cash needed
- —
Loan-product check · same deal, 3 products live
Conventional
25% down · 7.5% · 30yr
- Down + closing
- —
- Monthly P&I
- —
- Monthly cashflow
- —
- DSCR
- —
- Eligible?
- —
Personal DTI + credit; lowest rate.
DSCR
20% down · 8.5% · 30yr
- Down + closing
- —
- Monthly P&I
- —
- Monthly cashflow
- —
- DSCR
- —
- Eligible?
- —
No personal income docs; deal must DSCR.
Hard money
10% down · 12.0% · 12mo
- Down + closing
- —
- Monthly P&I
- —
- Monthly cashflow
- —
- DSCR
- —
- Eligible?
- —
Short-term bridge; refi at stabilization.
Listing history 4 events
-
2026-05-07status Pending
-
2026-05-04status Active
-
2026-05-01status Pending
-
2026-04-28$140,000 Active
ⓘ Source: listings_history table (triggers on properties + properties_extension) + one-shot
backfill from property_details.listing_events for pre-trigger history.
Tax reassessment forecast IA · Partial reset (capped growth)
- Current annual tax
- $1,836 · $153/mo
- Projected year-2 tax
- $2,017 · $168/mo
- Expected delta
- +$181/yr (+$15/mo · 9.9%)
ⓘ Screening estimate from a state-policy table — verify with the county assessor before closing.
Climate risk First Street
- Flood 1/10 Low FEMA zone X (unshaded) · 0% chance over 30 yrs
- Wildfire 2/10 Low
- Heat 3/10 Moderate 7 d/yr ≥104°F today · 16 d/yr by 30 yrs out
- Wind 2/10 Low
- Air quality 3/10 Moderate 2 unhealthy d/yr today · 3 by 30 yrs out
Nearby sold comps map
Loading sold comps map…
Walkable amenities ~0.75 mi
Loading nearby amenities…
Taxation est. · year 1
- Rental income
- $13,377
- − Mortgage interest
- −$7,842
- − Property taxes
- −$1,836
- − Insurance
- −$700
- − Repairs & maintenance
- −$1,070
- − Management
- −$1,070
- − Depreciation
- −$4,073
- Taxable loss
- −$3,215
- Est. tax savings @ 24.0%
- +$772
- After-tax cash flow
- $-7/yr
For passive investors: Depreciation is non-cash, so a rental often shows a tax loss while cash-flowing — sheltering income. Rental losses are passive: they offset passive income freely, and up to $25,000/yr can offset ordinary (W-2) income if you actively participate and your MAGI is under $100k (phasing out to $0 by $150k); unused losses carry forward. On sale, claimed depreciation is recaptured at up to 25%, and gains may owe capital-gains tax (a 1031 exchange can defer both). Figures are a year-1 estimate at your 24.0% rate — not tax advice; consult a CPA.
Schools (NCES district)
- District
- Davenport Community School District
- NCES district ID
- 1908580
- Math proficiency
- 43% ▼ -11.00%
- Reading proficiency
- 50% ▼ -3.00%
- Median HH income
- $46,157
- Composite
- 39.49/100
- National rank
- #3951
- State rank
- #288 of 289 in IA
Livability — Buffalo
- Score
- 72/100
- State rank
- #317
- US rank
- #6216
Category grades
Schools grade is shown separately in the Schools card above.
Census & demographics
- Census place
- Buffalo, IA
- City population
- 987
- Population (ZIP)
- 987
Population outlook (Scott County) Hauer SSP2
- Today (2025)
- 188,878 people
- By 2030
- 196,648 · +4.1%
- By 2040
- 210,860 · +11.6%
- By 2050
- 224,359 · +18.8%
- By 2075
- 258,884 · +37.1%
- By 2100
- 286,447 · +51.7%
Race, ethnicity, and origin ACS 2023
- Neighborhood character
- Predominantly White (87%)
- Race & ethnicity
- White 87% Hispanic / Latino 5% Two or more races 1%
- Hispanic origin (detail)
- Mexican 3%
- Common ancestry
- Slovak 2% Lithuanian 1% Ukrainian 1%
- Foreign-born
- 1%
- Languages at home
- 99% English-only · Arabic 1%
Political lean MEDSL · Scott
- 2024 margin
- Toss-up / Even · D 47.3% · R 51.2% · Other 1.4%
- 2008→2024 swing
- -18.4pp toward R · 2008: 14.6pp · 2024: -3.9pp
- All cycles
- 2024: R+3.9 2020: D+3.5 2016: D+1.4 2012: D+13.8 2008: D+14.6
Not yet ingested
- Civics
- —
Market trends
- HPI YoY
- ▲ 1.54%
- Current HPI
- 188.6115
- Rent YoY
- —
- Metro
- —
- State GDP YoY
- ▲ 2.48%
- F500 in state
- 4
Industry mix (Fortune 500 HQ in IA)
| Industry | F500 HQs | Revenue |
|---|---|---|
| Financial Services | 1 | $16B |
|
||
| Retail / Convenience | 1 | $15B |
|
||
Price history
4 events — show timeline
- 2026-05-07 Pending — MRED as Distributed by MLS Grid
- 2026-05-04 Relisted — MRED as Distributed by MLS Grid
- 2026-05-01 Pending — MRED as Distributed by MLS Grid
- 2026-04-28 Listed $140,000 MRED as Distributed by MLS Grid
Property tax history
+2.6%/yrLatest (2025): $1,836 · -0.8% YoY. Source: county tax records.
Cash-flow waterfall
monthlySold comps — $/sqft
last 12 mo · ≤1 miLoading sold comps…