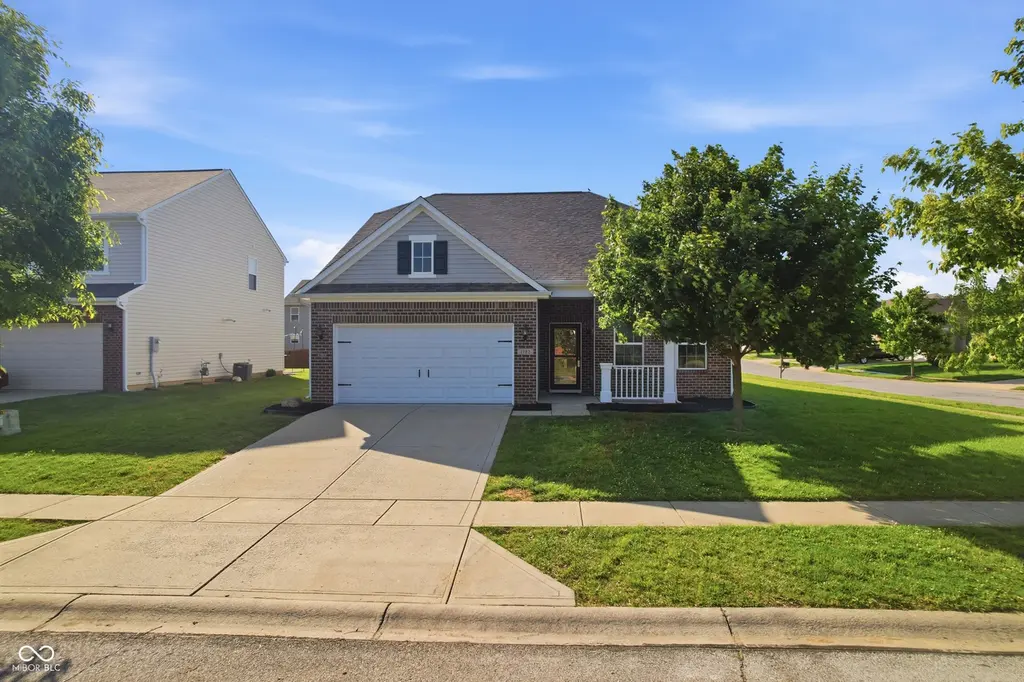
1782 Redbay Dr
Avon, IN 46234
$300,000D-
3 bd · 2.0 ba ·
1,686 sqft ·
Built 2014
· SingleFamily
· Pending
· 2 DOM
Cashflow @ list (25.0% down · 7.5%)
Estimated rent
$2,251/mo
Mortgage (P&I)
−$1,573
Tax + insurance
−$307
HOA
−$55
Vac / Maint / Mgmt
−$473
Net cashflow
$-157/mo
Annual
$-1,878/yr
Cap rate
5.67%
Cash-on-cash
-2.24%
DSCR
0.90
1% rule
0.75%
Cash to close
$84,000
Investor read
- This is a 3-bed/2.0-bath single-family listed at $300k.
- At list price, monthly cash flow is $-157 ($-2k/yr) — negative.
- To cash-flow at today's rent, offer at most $272k (9.2% below list).
- To meet the 1% rule (rent ≥ 1% of price), the offer needs to be $225k (25.0% below list).
- Only 2 days on market — expect competitive offers; lowballing is unlikely to land.
- Recommended offer: $225k (25.0% below list) — sets the bar for 1% rule.
- Local home prices are declining (-3.0%/yr); year-one equity from $2k of loan paydown is wiped out by about $9k of value loss. Plan a longer hold.
- Location reads 74/100 on livability (#75 in IN, #4,686 nationally) — a middle-class / working-renter tenant base. Strengths: employment A+, cost of living A+, housing A+; Watch: amenities F, commute F.
- Avon Community School Corporation (suburban): math 51% / reading 53% proficiency, ranked #32 of 301 in IN (top 11%) — acceptable for families but not a draw, mixed tenant base, ~2y average lease; only 20% free/reduced lunch — higher-income household profile.
- Zoned schools: Sycamore Elementary School (math 67% / reading 52%, grade B-, #128 of 994 statewide, top 15%, 541 students, 47% FRL); Avon High School (math 44% / reading 76%, grade C+, #46 of 369 statewide, top 13%, 3,348 students, 38% FRL) — zoned schools average 43% FRL vs 20% district-wide (23 pts higher); higher-poverty schools than district average — tighter screening recommended.
- Market conditions: Rents rising fast (+7.6%/yr); 64 active listings in the ZIP; 12 comparable units currently listed for rent nearby; rentals at typical pace (median 18d on market — plan ~3-4 weeks tenant-placement turnaround); solid renter incomes; 1,294 units permitted in Hendricks County in 2024 (18 in 5+ unit buildings).
- Hendricks County population projected at +35% by 2050 — long-run rental-demand tailwind backs the buy-and-hold thesis.
- Cap rate 5.7% vs local median 3.8% in Avon — top-decile yield for the area; either an underpriced asset or a hidden risk that comps aren't pricing in. Stress-test before assuming the spread holds.
- This rent runs 32% of the median local income ($83k/yr) — at the standard rent-burdened threshold; future hikes will face affordability resistance.
Questions for listing agent
- What do current leases actually rent for vs. the listed asking? Can we see a recent rent roll and the last 12 months of T-12 income?
- What does the HOA fee cover, when was the last increase, and are there any pending special assessments or reserve-fund shortfalls?
- Is there a deadline driving the sale (1031 exchange, divorce, estate, relocation)? That informs how much negotiation room exists.
- Schools are A-rated — typically a magnet for longer-tenancy family renters. What's the average tenant stay here, and is there a school-zone premium baked into asking?
- The area grade is low — what's the realistic commute time and amenity access for the typical tenant pool here? Any planned neighborhood developments (good or bad) we should know about?
- What's the average days-on-market for RENTAL listings here right now (not sales)? A rising rental-DOM trend means longer vacancies and softer asking-rent achievability than the comps imply.
- What's the recent tenant-quality profile in this submarket — average credit score on applications, eviction rate, late-payment / NSF rate, and stable-employment percentage? A property-management company in the area should have these aggregated.
- How much new for-sale + rental construction is in the pipeline within 1–3 miles? Heavy new supply typically softens prices + rents 12–24 months out; constrained supply supports both.
CashFlowRE · CFR-SPCFDH0W2RTGF8
· Data 3 weeks ago
cashflowre.app · 2026-05-29