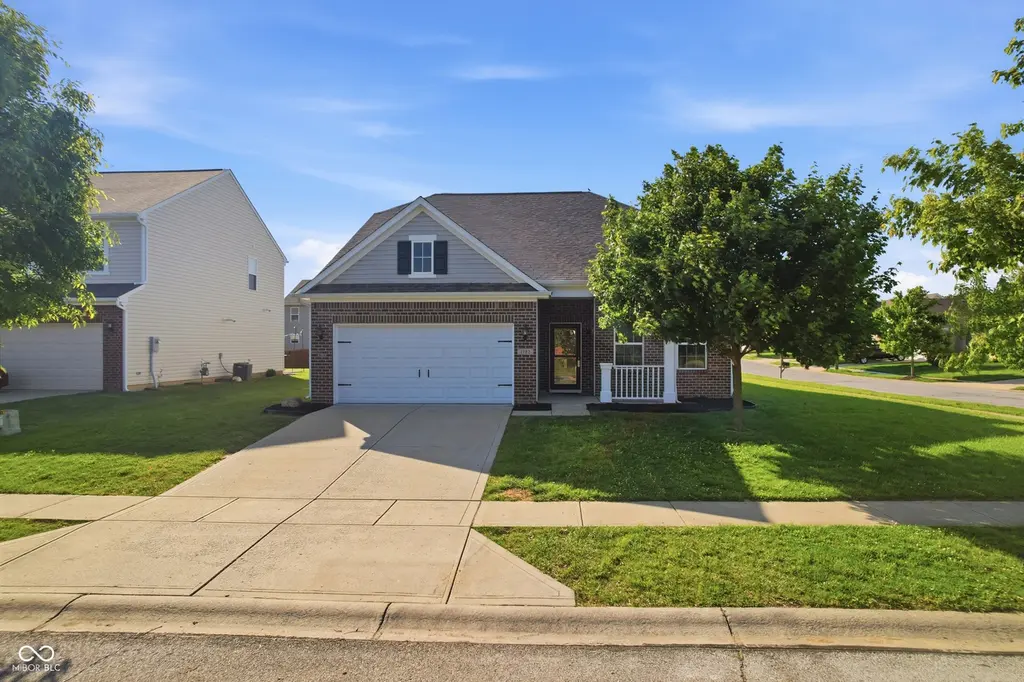
1782 Redbay Dr · Avon, IN
Flood risk 1/10 · Minimal
- FEMA flood zone
- X (unshaded)
- Chance of flooding over 30 yrs
- 0.0%
- Est. flood insurance / yr
- $507 – $1,088
Fire risk 1/10 · Minimal
- Est. fire insurance / yr
- $717 – $1,331
Heat risk 4/10 · Minor
- Hot days now (above 101°F)
- 7 days/yr
- Hot days in 30 yrs
- 19 days/yr
Wind risk 2/10 · Minimal
- Chance of severe wind over 30 yrs
- 1.0%
Air-quality risk 4/10 · Minor
- Unhealthy air days now
- 4 days/yr
- Unhealthy air days in 30 yrs
- 5 days/yr
Risk factors via First Street. Map © Google.
Why this score? — see what drove the D- grade
The composite is a weighted blend of 9 inputs, each scored 0–100. Each bar is that input's sub-score; the figure is the points it added to the 100-point composite (weight × sub-score).
- Cash flow +10.4/30.0
- ARV discount +6.2/15.0
- Schools +4.7/10.0
- Rent growth +4.4/5.0
- Livability +3.7/5.0
- DSCR +3.0/10.0
- 1% rule +2.5/10.0
- Condition / age +2.5/5.0
- Appreciation +0.0/10.0
$300,000
🖨 Deal sheet 📄 Offer letter ✓ Due diligence
Listing remarks
Discover the comfortable living at 1782 Redbay DR, INDIANAPOLIS, IN. Located in Hendricks County/Avon School district and built in 2014, this single-family residence spans a generous 1686 square feet, offering a modern foundation for your lifestyle. The property's single-story layout is thoughtfully designed showcasing 9ft ceilings and open concept, presenting a harmonious blend of functionality and style. The sleek kitchen boasts updates including new counter tops and brand new SS APPLIANCES! The home has been updated with luxury vinyl plank flooring in main living spaces as well as fresh paint throughout. The four well-proportioned bedrooms adorned with new carpet in each, offer ample per
Key facts
- Single-story layout
- New counter tops
- 9ft ceilings
Tags
Property features AI
Finance
- Other: Ownership interest: Mandatory fee
- HOA & community: Has HOA; annual fee of $660
Exterior
- Parking: Attached 2-car garage (approx. 400 sq ft)
- Utilities: Public water; Municipal sewer connected; 200+ amp electric service; Electricity, sewer and water connected
- Home design: Single-family residence; Updated/remodeled condition; One story
- Construction: Vinyl with brick exterior; Slab foundation
- Exterior features: Covered patio/porch; Patio; No fence
Interior
- Kitchen: Dishwasher; Disposal; Microwave; Electric oven; Refrigerator
- Bedrooms: Four bedrooms on the main level
- Bathrooms: Two full bathrooms on the main level
- Heating & cooling: Forced air heating; Central air conditioning
- Interior features: High ceilings; Utility room
- Laundry & utility: Laundry on main level
Neighborhood map
What this means for you Summary
Snapshot
- This is a 3-bed/2.0-bath single-family listed at $300k.
Deal economics
- At list price, monthly cash flow is $-157 ($-2k/yr) — negative.
- To cash-flow at today's rent, offer at most $272k (9.2% below list).
- To meet the 1% rule (rent ≥ 1% of price), the offer needs to be $225k (25.0% below list).
- Recommended offer: $225k (25.0% below list) — sets the bar for 1% rule.
- Cap rate 5.7% vs local median 3.8% in Avon — top-decile yield for the area; either an underpriced asset or a hidden risk that comps aren't pricing in. Stress-test before assuming the spread holds.
Location & tenants
- Location reads 74/100 on livability (#75 in IN, #4,686 nationally) — a middle-class / working-renter tenant base. Strengths: employment A+, cost of living A+, housing A+; Watch: amenities F, commute F.
- Avon Community School Corporation (suburban): math 51% / reading 53% proficiency, ranked #32 of 301 in IN (top 11%) — acceptable for families but not a draw, mixed tenant base, ~2y average lease; only 20% free/reduced lunch — higher-income household profile.
- Zoned schools: Sycamore Elementary School (math 67% / reading 52%, grade B-, #128 of 994 statewide, top 15%, 541 students, 47% FRL); Avon High School (math 44% / reading 76%, grade C+, #46 of 369 statewide, top 13%, 3,348 students, 38% FRL) — zoned schools average 43% FRL vs 20% district-wide (23 pts higher); higher-poverty schools than district average — tighter screening recommended.
- Market conditions: Rents rising fast (+7.6%/yr); 64 active listings in the ZIP; 12 comparable units currently listed for rent nearby; rentals at typical pace (median 18d on market — plan ~3-4 weeks tenant-placement turnaround); solid renter incomes; 1,294 units permitted in Hendricks County in 2024 (18 in 5+ unit buildings).
- This rent runs 32% of the median local income ($83k/yr) — at the standard rent-burdened threshold; future hikes will face affordability resistance.
Forward outlook
- Local home prices are declining (-3.0%/yr); year-one equity from $2k of loan paydown is wiped out by about $9k of value loss. Plan a longer hold.
- Hendricks County population projected at +35% by 2050 — long-run rental-demand tailwind backs the buy-and-hold thesis.
Negotiation context
- Only 2 days on market — expect competitive offers; lowballing is unlikely to land.
Questions for the listing agent
- What do current leases actually rent for vs. the listed asking? Can we see a recent rent roll and the last 12 months of T-12 income?
- What does the HOA fee cover, when was the last increase, and are there any pending special assessments or reserve-fund shortfalls?
- Is there a deadline driving the sale (1031 exchange, divorce, estate, relocation)? That informs how much negotiation room exists.
- Schools are A-rated — typically a magnet for longer-tenancy family renters. What's the average tenant stay here, and is there a school-zone premium baked into asking?
- The area grade is low — what's the realistic commute time and amenity access for the typical tenant pool here? Any planned neighborhood developments (good or bad) we should know about?
- What's the average days-on-market for RENTAL listings here right now (not sales)? A rising rental-DOM trend means longer vacancies and softer asking-rent achievability than the comps imply.
- What's the recent tenant-quality profile in this submarket — average credit score on applications, eviction rate, late-payment / NSF rate, and stable-employment percentage? A property-management company in the area should have these aggregated.
- How much new for-sale + rental construction is in the pipeline within 1–3 miles? Heavy new supply typically softens prices + rents 12–24 months out; constrained supply supports both.
Investment metrics
- 1% rule
- 0.75% ✗
- Cap rate
- 5.67%
- Cash-on-cash
- -2.24%
- DSCR
- 0.90
- GRM
- 11.1
CMA / ARV
- ARV (on-the-fly)
- $291,678
- Comps found
- 12
Show comp detail 12 sales within ~0.75 mi
| Address | Dist | Beds/Ba | Sqft | Sold | Price | $/sf | Match |
|---|---|---|---|---|---|---|---|
| 1782 Redbay Dr | 0.00mi | 4/2.0 (+1) | 1,686 (0%) | 0mo | $310,000 | $184 | 95 |
| 1782 Honeylocust Dr | 0.07mi | 4/2.0 (+1) | 1,691 (+0%) | 8mo | $291,900 | $173 | 85 |
| 10471 Serviceberry Dr | 0.15mi | 4/2.0 (+1) | 1,760 (+4%) | 4mo | $295,000 | $168 | 77 |
| 10406 Waverly Dr | 0.51mi | 3/2.0 | 1,516 (-10%) | 2mo | $247,500 | $163 | 58 |
| 10860 Vanguard Ln | 0.54mi | 3/2.0 | 1,534 (-9%) | 5mo | $272,000 | $177 | 56 |
| 10479 Wintergreen Way | 0.49mi | 3/2.5 | 1,802 (+7%) | 10mo | $246,000 | $137 | 55 |
| 2358 Wynbrooke Blvd | 0.62mi | 3/2.5 | 1,824 (+8%) | 2mo | $290,000 | $159 | 54 |
| 1234 Castleford Ln | 0.58mi | 3/2.0 | 1,496 (-11%) | 1mo | $295,000 | $197 | 54 |
| 10439 Secretariat Dr | 0.54mi | 4/2.0 (+1) | 1,816 (+8%) | 7mo | $283,000 | $156 | 52 |
| 2328 Black Gold Dr | 0.67mi | 3/2.5 | 1,602 (-5%) | 9mo | $292,000 | $182 | 51 |
| 10762 Caval Cade Ct | 0.54mi | 3/2.0 | 1,926 (+14%) | 6mo | $295,000 | $153 | 46 |
| 1238 Valley Forge Dr | 0.75mi | 3/2.5 | 1,505 (-11%) | 9mo | $284,999 | $189 | 37 |
Match score weights: distance 35% · size 25% · config 20% · recency 20%. Top-matched comps best support the ARV.
Projected returns pro-forma
-3.0% appreciation · 7.56% rent growth · sell at horizon
- IRR
- -15.4%
- Equity multiple
- 0.43×
- Total profit
- $-47,828
- Equity at exit
- $44,731
- IRR
- -0.9%
- Equity multiple
- 0.93×
- Total profit
- $-5,969
- Equity at exit
- $25,939
Cash invested: $84,000 (down + closing). Projections, not guarantees.
Landlord ↔ Tenant lean methodology
- Overall (STATE)
- 90 Strongly Landlord-Friendly
- State Indiana
- 90 Strongly Landlord-Friendly · R+11
- County
- — inherits STATE
- City
- — inherits STATE
ZIP-level market 46234
- Home prices YoY
- -33.0%
- Rents YoY
- 7.6%
- Active inventory
- 64
- Price-to-rent
- 11.1×
Monthly cashflow live
- Estimated rent
- $2,251 high interval (Pro) →
- Mortgage (P&I)
- −$1,573
- Tax from tax record
- −$182 /mo · $2,183/yr
- Insurance
- −$125
- HOA
- −$55
- Vacancy / Maint / Mgmt
- −$473
- Net cashflow
- $-157
Break-even live
UW: 25.0% down · 7.5% · 30yr · 1.5% tax · 5.0% vac · 8.0% maint · 8.0% mgmt
Financing live
Cash to close
- Down payment
- $75,000
- Closing costs
- $9,000
- Reserves months
- —
- Total cash needed
- —
Loan-product check · same deal, 3 products live
Conventional
25% down · 7.5% · 30yr
- Down + closing
- —
- Monthly P&I
- —
- Monthly cashflow
- —
- DSCR
- —
- Eligible?
- —
Personal DTI + credit; lowest rate.
DSCR
20% down · 8.5% · 30yr
- Down + closing
- —
- Monthly P&I
- —
- Monthly cashflow
- —
- DSCR
- —
- Eligible?
- —
No personal income docs; deal must DSCR.
Hard money
10% down · 12.0% · 12mo
- Down + closing
- —
- Monthly P&I
- —
- Monthly cashflow
- —
- DSCR
- —
- Eligible?
- —
Short-term bridge; refi at stabilization.
Rent comps 12 comps
| Address | Beds | Baths | Sqft | Rent | $/sqft | DOM | Units | Dist |
|---|---|---|---|---|---|---|---|---|
| 10341 Buckshire Ln Indianapolis, IN | 3.0 | 2.0 | 1257 | $1,779 | $1.42 | 43d | 1 | 0.36mi |
| 2135 Redland Rd Indianapolis, IN | 2.0–3.0 | 2.0 | 1136 | $1,429 | $1.26 | 1d | 1 | 0.40mi |
| 10363 Fairmont Ln Unit 1522300P Indianapolis, IN | 3.0 | 2.0 | 2152 | $3,695 | $1.72 | 1d | 1 | 0.44mi |
| 10483 Day Star Dr Indianapolis, IN | 3.0 | 2.5 | 1840 | $2,071 | $1.13 | 43d | 1 | 0.45mi |
| 1267 Constitution Dr Indianapolis, IN | 4.0 | 2.5 | 2228 | $2,455 | $1.10 | 14d | 1 | 0.70mi |
| 1135 Valley Forge Dr Indianapolis, IN | 3.0 | 2.5 | 1550 | $1,979 | $1.28 | 23d | 1 | 0.86mi |
| 10435 Cox Pl Indianapolis, IN | 1.0–2.0 | 1.0–2.0 | 999 | $1,625 | $1.63 | 43d | 1 | 0.91mi |
| 781 Hollowood Ln Avon, IN | 3.0 | 2.0 | 1370 | $1,800 | $1.31 | 43d | 1 | 1.12mi |
| 9692 Stonewall Ln Avon, IN | 3.0 | 2.0 | 1505 | $2,150 | $1.43 | 16d | 1 | 1.16mi |
| 9762 Trail Dr Avon, IN | 3.0 | 2.0 | 1212 | $1,901 | $1.57 | 1d | 1 | 1.40mi |
| 8840 Ingram Ln Avon, IN | 3.0 | 2.5 | 1899 | $2,150 | $1.13 | 17d | 1 | 1.46mi |
| 9661 Trail Dr Avon, IN | 3.0 | 2.0 | 1444 | $1,925 | $1.33 | 17d | 1 | 1.47mi |
HOA detail
- Monthly dues
- $55 · $660/yr
Listing history 2 events
-
2026-05-15status Pending
-
2026-05-13$300,000 Active
ⓘ Source: listings_history table (triggers on properties + properties_extension) + one-shot
backfill from property_details.listing_events for pre-trigger history.
Tax reassessment forecast IN · Partial reset (capped growth)
- Current annual tax
- $2,183 · $182/mo
- Projected year-2 tax
- $2,367 · $197/mo
- Expected delta
- +$183/yr (+$15/mo · 8.4%)
ⓘ Screening estimate from a state-policy table — verify with the county assessor before closing.
Climate risk First Street
- Flood 1/10 Low FEMA zone X (unshaded) · 0% chance over 30 yrs
- Wildfire 1/10 Low
- Heat 4/10 Moderate 7 d/yr ≥101°F today · 19 d/yr by 30 yrs out
- Wind 2/10 Low 100% chance of damaging wind over 30 yrs
- Air quality 4/10 Moderate 4 unhealthy d/yr today · 5 by 30 yrs out
Nearby sold comps map
Loading sold comps map…
Walkable amenities ~0.75 mi
Loading nearby amenities…
Taxation est. · year 1
- Rental income
- $27,018
- − Mortgage interest
- −$16,805
- − Property taxes
- −$2,183
- − Insurance
- −$1,500
- − Repairs & maintenance
- −$2,161
- − Management
- −$2,161
- − HOA
- −$660
- − Depreciation
- −$8,727
- Taxable loss
- −$7,180
- Est. tax savings @ 24.0%
- +$1,723
- After-tax cash flow
- $-155/yr
For passive investors: Depreciation is non-cash, so a rental often shows a tax loss while cash-flowing — sheltering income. Rental losses are passive: they offset passive income freely, and up to $25,000/yr can offset ordinary (W-2) income if you actively participate and your MAGI is under $100k (phasing out to $0 by $150k); unused losses carry forward. On sale, claimed depreciation is recaptured at up to 25%, and gains may owe capital-gains tax (a 1031 exchange can defer both). Figures are a year-1 estimate at your 24.0% rate — not tax advice; consult a CPA.
Schools (NCES district)
- District
- Avon Community School Corporation
- NCES district ID
- 1800270
- Math proficiency
- 51% ▼ -8.00%
- Reading proficiency
- 53% ▼ -8.00%
- Median HH income
- $75,987
- Composite
- 46.93/100
- National rank
- #2362
- State rank
- #32 of 301 in IN
Livability — Avon
- Score
- 74/100
- State rank
- #75
- US rank
- #4686
Category grades
Schools grade is shown separately in the Schools card above.
Census & demographics
- Census place
- Avon, IN
- County
- Marion County · 998,460 people
- City population
- 43,353
- Metro
- Indianapolis-Carmel-Anderson, IN
- Population (ZIP)
- 28,300
- Household income
- $83,190
- Rent vs Own
- Severe rent burden
- 764.0
Population outlook (Hendricks County) Hauer SSP2
- Today (2025)
- 187,418 people
- By 2030
- 201,494 · +7.5%
- By 2040
- 228,487 · +21.9%
- By 2050
- 253,068 · +35.0%
- By 2075
- 308,920 · +64.8%
- By 2100
- 336,510 · +79.6%
Race, ethnicity, and origin ACS 2023
- Neighborhood character
- Diverse neighborhood (Simpson 0.56)
- Race & ethnicity
- White 63% Black 19% Hispanic / Latino 10% Two or more races 7% Asian 4%
- Hispanic origin (detail)
- Mexican 6%
- Common ancestry
- Italian 2% Romanian 2% Iranian 2%
- Foreign-born
- 11% · Canada, China, United Kingdom
- Languages at home
- 82% English-only · Spanish 8% Other Indo-European 3% French/Haitian/Cajun 3%
Political lean MEDSL · Hendricks
- 2024 margin
- Strong R (+21.5) · D 38.4% · R 59.9% · Other 1.7%
- 2008→2024 swing
- +1.9pp toward D · 2008: -23.4pp · 2024: -21.5pp
- All cycles
- 2024: R+21.5 2020: R+23.9 2016: R+34.2 2012: R+34.9 2008: R+23.4
Not yet ingested
- Civics
- —
Market trends
- HPI YoY
- ▼ -106.23%
- Current HPI
- 215.5854
- Rent YoY
- ▲ 7.56%
- Metro
- Indianapolis-Carmel-Anderson, IN
- State GDP YoY
- ▲ 2.90%
- F500 in state
- 18
Industry mix (Fortune 500 HQ in IN)
| Industry | F500 HQs | Revenue |
|---|---|---|
| Industrial Machinery | 2 | $37B |
|
||
| Healthcare | 1 | $177B |
|
||
| Pharmaceuticals | 1 | $45B |
|
||
| Metals / Steel | 1 | $18B |
|
||
| Agriculture | 1 | $17B |
|
||
| Packaging | 1 | $12B |
|
||
Price history
2 events — show timeline
- 2026-05-15 Pending — MIBOR as Distributed by MLS Grid
- 2026-05-13 Listed $300,000 MIBOR as Distributed by MLS Grid
Property tax history
+42.9%/yrLatest (2025): $2,183 · +20.0% YoY. Source: county tax records.
Cash-flow waterfall
monthlySold comps — $/sqft
last 12 mo · ≤1 miLoading sold comps…