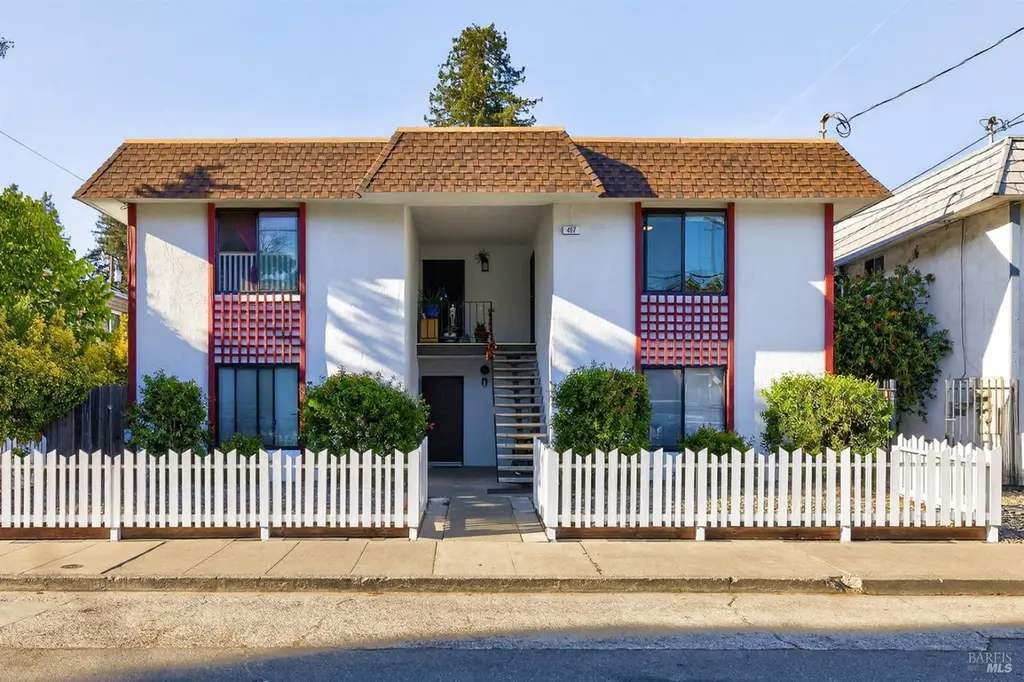
497 Sebastopol Ave
Santa Rosa, CA 95401
$1,075,000D-
6 bd · 4.0 ba ·
2,944 sqft ·
Built 1970
· MultiFamily
· Active
· 17 DOM
Cashflow @ list (25.0% down · 7.5%)
Estimated rent
$8,620/mo
Mortgage (P&I)
−$5,637
Tax + insurance
−$1,072
HOA
−$0
Vac / Maint / Mgmt
−$1,810
Net cashflow
$100/mo
Annual
$1,204/yr
Cap rate
6.48%
Cash-on-cash
0.66%
DSCR
1.03
1% rule
0.80%
Cash to close
$301,000
Investor read
- This is a 2×2bd/1ba + 2×1bd/1ba units multifamily listed at $1.07M.
- At list price, monthly cash flow is $100 ($1k/yr) — positive. Per door: $25/mo.
- The deal already cash-flows at list — no discount required.
- To meet the 1% rule (rent ≥ 1% of price), the offer needs to be $862k (19.8% below list).
- It's been on market 17 days — a 2% lower offer ($1.06M) is reasonable based on typical stale-listing flexibility.
- Recommended offer: $862k (19.8% below list) — sets the bar for 1% rule.
- Local home prices are declining (-3.0%/yr); year-one equity from $7k of loan paydown is wiped out by about $32k of value loss. Plan a longer hold.
- Location reads 75/100 on livability (#112 in CA, #3,940 nationally) — a middle-class / working-renter tenant base. Strengths: amenities A+, commute A+, employment A+; Watch: schools C-, cost of living F.
- Santa Rosa High (urban): math 31% / reading 47% proficiency, ranked #703 of 1,400 in CA (top 50%) — families likely to look elsewhere, expect single-tenant / working-renter base with shorter leases.
- Watch-outs: flood insurance adds $66/mo.
- Market conditions: Rents soft (-1.4%/yr); 79 active listings in the ZIP; solid renter incomes; 1,039 units permitted in Sonoma County in 2024 (185 in 5+ unit buildings).
- Sonoma County population projected at +8% by 2050 — modest demand growth; plan on rents tracking national, not racing it.
- 3 sale attempts with the ask held roughly flat each time — persistent listings suggest the price (not the market) is what's stuck; bring a comps-based counter.
- Current owner paid $382k; list at $1.07M implies a 182% gain — meaningful room to come down on a strong offer.
- Climate carrying-cost: major flood risk; moderate wildfire risk — expect insurance premiums to compound above CPI over the hold.
- Cap rate 6.5% vs local median 2.5% in Santa Rosa — top-decile yield for the area; either an underpriced asset or a hidden risk that comps aren't pricing in. Stress-test before assuming the spread holds.
- At $8,620/mo this rent would consume 110% of the median local household income ($94k/yr) (locally 1525% of renters already pay >50% of income on rent) — very limited rent-growth headroom before tenants either downsize or default.
Questions for listing agent
- Can we see the unit-by-unit rent roll, current vacancy, and any below-market leases? What's the average tenancy length?
- What capital expenditures (roof, boiler, parking lot, exteriors) have been made in the last 5 years, and what's planned in the next 2?
- Built in 1970 — when were the roof, HVAC, electrical panel, plumbing, and water heater last replaced?
- What's the actual annual flood-insurance premium (NFIP or private), and is the property in a SFHA with mandatory coverage?
- Is there a deadline driving the sale (1031 exchange, divorce, estate, relocation)? That informs how much negotiation room exists.
- The area grade is low — what's the realistic commute time and amenity access for the typical tenant pool here? Any planned neighborhood developments (good or bad) we should know about?
- What's the average days-on-market for RENTAL listings here right now (not sales)? A rising rental-DOM trend means longer vacancies and softer asking-rent achievability than the comps imply.
- What's the recent tenant-quality profile in this submarket — average credit score on applications, eviction rate, late-payment / NSF rate, and stable-employment percentage? A property-management company in the area should have these aggregated.
CashFlowRE · CFR-SRE974419HQ5S0
· Data 6 h ago
cashflowre.app · 2026-05-29