 Fourplex
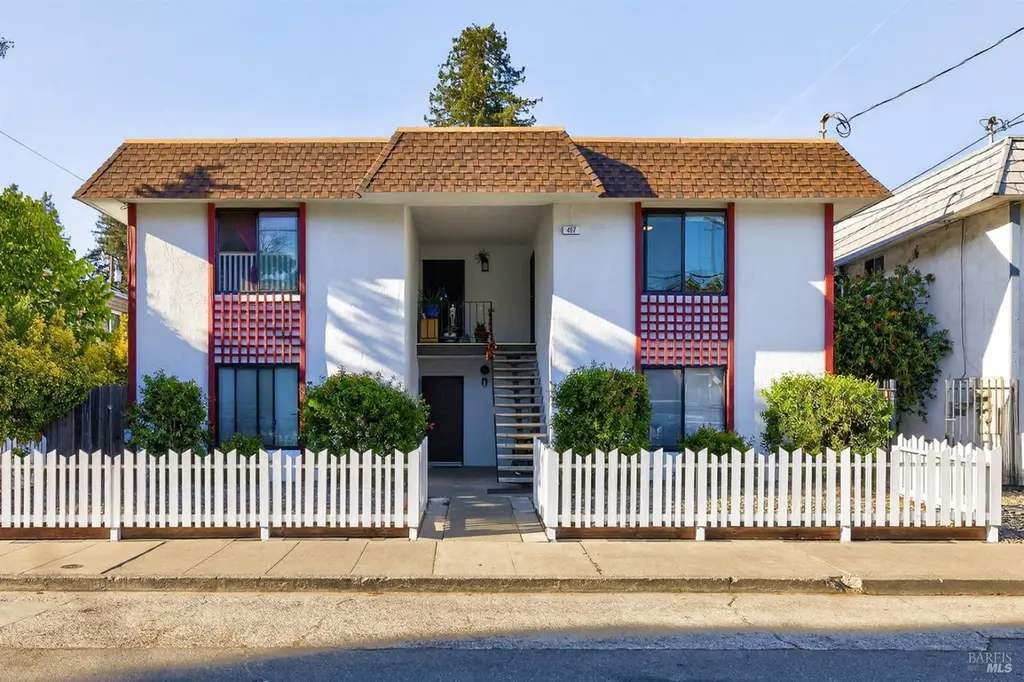
497 Sebastopol Ave · Santa Rosa, CA
Flood risk 7/10 · Major
- FEMA flood zone
- X (unshaded)
- Chance of flooding over 30 yrs
- 0.98%
- Est. flood insurance / yr
- $507 – $1,088
Fire risk 5/10 · Moderate
- Est. fire insurance / yr
- $659 – $1,223
Heat risk 4/10 · Minor
- Hot days now (above 92°F)
- 7 days/yr
- Hot days in 30 yrs
- 15 days/yr
Wind risk 1/10 · Minimal
- Chance of severe wind over 30 yrs
- —
Air-quality risk 8/10 · Major
- Unhealthy air days now
- 15 days/yr
- Unhealthy air days in 30 yrs
- 17 days/yr
Risk factors via First Street. Map © Google.
Why this score? — see what drove the D- grade
The composite is a weighted blend of 9 inputs, each scored 0–100. Each bar is that input's sub-score; the figure is the points it added to the 100-point composite (weight × sub-score).
- Cash flow +14.1/30.0
- DSCR +4.3/10.0
- Livability +3.8/5.0
- Schools +3.7/10.0
- ARV discount +3.6/15.0
- 1% rule +3.0/10.0
- Condition / age +2.5/5.0
- Rent growth +2.2/5.0
- Appreciation +0.0/10.0
$1,075,000
🖨 Deal sheet (PDF) 📄 Offer letter ✓ Due diligence
Multi-family units
County records classify this as Multi-Family (2-4 Unit). Listing-text estimate: 4 units. confirmed
Listing remarks
Rare opportunity to purchase this turn-key fourplex in the heart of central Santa Rosa's South A Street Arts District. This well-maintained property consists of two 2-bedroom/1-bath units and two 1-bedroom/1-bath units, with three units occupied by cooperative, long-term tenants. Recently painted, the building offers excellent curb appeal with an attractive stucco exterior and low-maintenance landscaping. All four units were extensively updated between 2018-2019, with over $100,000 in improvements, including new kitchen cabinets, quartz countertops, stainless appliances, upgraded bathrooms, modern lighting, and refreshed interiors. Additional amenities include covered carports with access f
Key facts
- Extensively updated
- New kitchen cabinets
- Turn-key fourplex
Tags
Property features AI
Finance
- HOA & community: No homeowners association
Exterior
- Parking: Seven parking spaces; Covered and open parking
- Utilities: Public sewer
- Home design: Residential income property (quadruplex)
- Exterior features: Lot includes other features
Interior
- Kitchen: Dishwasher; Free standing electric range
- Bedrooms: Two 2-bedroom apartments; Two 1-bedroom apartments
- Bathrooms: Three units with 1 full bathroom (total count by unit: Unit1 — 1, Unit2 — 1, Unit4 — 1)
- Heating & cooling: Central heating; No cooling
- Interior features: Dishwasher; Free standing electric range; Coin-operated laundry in a common area; No basement
- Laundry & utility: Coin-operated laundry located in a common area
Neighborhood map
What this means for you Summary
Snapshot
- This is a 2×2bd/1ba + 2×1bd/1ba units multifamily listed at $1.07M.
Deal economics
- At list price, monthly cash flow is $100 ($1k/yr) — positive. Per door: $25/mo.
- The deal already cash-flows at list — no discount required.
- To meet the 1% rule (rent ≥ 1% of price), the offer needs to be $862k (19.8% below list).
- Recommended offer: $862k (19.8% below list) — sets the bar for 1% rule.
- Cap rate 6.5% vs local median 2.5% in Santa Rosa — top-decile yield for the area; either an underpriced asset or a hidden risk that comps aren't pricing in. Stress-test before assuming the spread holds.
Location & tenants
- Location reads 75/100 on livability (#112 in CA, #3,940 nationally) — a middle-class / working-renter tenant base. Strengths: amenities A+, commute A+, employment A+; Watch: schools C-, cost of living F.
- Santa Rosa High (urban): math 31% / reading 47% proficiency, ranked #703 of 1,400 in CA (top 50%) — families likely to look elsewhere, expect single-tenant / working-renter base with shorter leases.
- Market conditions: Rents soft (-1.4%/yr); 78 active listings in the ZIP; solid renter incomes; 1,039 units permitted in Sonoma County in 2024 (185 in 5+ unit buildings).
- At $8,620/mo this rent would consume 110% of the median local household income ($94k/yr) (locally 1525% of renters already pay >50% of income on rent) — very limited rent-growth headroom before tenants either downsize or default.
Forward outlook
- Local home prices are declining (-3.0%/yr); year-one equity from $7k of loan paydown is wiped out by about $32k of value loss. Plan a longer hold.
- Sonoma County population projected at +8% by 2050 — modest demand growth; plan on rents tracking national, not racing it.
Negotiation context
- Only 14 days on market — expect competitive offers; lowballing is unlikely to land.
- 3 sale attempts with the ask held roughly flat each time — persistent listings suggest the price (not the market) is what's stuck; bring a comps-based counter.
- Current owner paid $382k; list at $1.07M implies a 182% gain — meaningful room to come down on a strong offer.
Risks & watch-outs
- Watch-outs: flood insurance adds $66/mo.
- Climate carrying-cost: major flood risk; moderate wildfire risk — expect insurance premiums to compound above CPI over the hold.
Questions for the listing agent
- Can we see the unit-by-unit rent roll, current vacancy, and any below-market leases? What's the average tenancy length?
- What capital expenditures (roof, boiler, parking lot, exteriors) have been made in the last 5 years, and what's planned in the next 2?
- Built in 1970 — when were the roof, HVAC, electrical panel, plumbing, and water heater last replaced?
- What's the actual annual flood-insurance premium (NFIP or private), and is the property in a SFHA with mandatory coverage?
- Is there a deadline driving the sale (1031 exchange, divorce, estate, relocation)? That informs how much negotiation room exists.
- The area grade is low — what's the realistic commute time and amenity access for the typical tenant pool here? Any planned neighborhood developments (good or bad) we should know about?
- What's the average days-on-market for RENTAL listings here right now (not sales)? A rising rental-DOM trend means longer vacancies and softer asking-rent achievability than the comps imply.
- What's the recent tenant-quality profile in this submarket — average credit score on applications, eviction rate, late-payment / NSF rate, and stable-employment percentage? A property-management company in the area should have these aggregated.
- How much new apartment / multifamily construction is in the pipeline within 1–3 miles? Heavy new supply (>2% of stock underway) typically softens rents 12–24 months out; light construction supports rent growth.
Investment metrics
- 1% rule
- 0.80% ✗
- Cap rate
- 6.48%
- Cash-on-cash
- 0.66%
- DSCR
- 1.03
- GRM
- 10.4
CMA / ARV
- ARV (on-the-fly)
- $989,184
- Comps found
- 1
Show comp detail 1 sale within ~0.75 mi
| Address | Dist | Beds/Ba | Sqft | Sold | Price | $/sf | Match |
|---|---|---|---|---|---|---|---|
| 516 Goodman Ave | 0.64mi | 7/3.0 (+1) | 2,672 (-9%) | 22mo | $897,500 | $336 | 27 |
Match score weights: distance 35% · size 25% · config 20% · recency 20%. Top-matched comps best support the ARV.
Projected returns pro-forma
-3.0% appreciation · 0.0% rent growth · sell at horizon
- IRR
- -18.8%
- Equity multiple
- 0.36×
- Total profit
- $-193,381
- Equity at exit
- $160,286
- IRR
- -18.1%
- Equity multiple
- 0.14×
- Total profit
- $-259,061
- Equity at exit
- $92,946
Cash invested: $301,000 (down + closing). Projections, not guarantees.
Landlord ↔ Tenant lean methodology
- Overall (STATE)
- 18 Strongly Tenant-Friendly
- State California
- 18 Strongly Tenant-Friendly · D+13
- County
- — inherits STATE
- City
- — inherits STATE
ZIP-level market 95401
- Rents YoY
- -1.4%
- Active inventory
- 78
- Price-to-rent
- 38.5×
Monthly cashflow live
- Estimated rent
- $8,620 high interval (Pro) →
- Mortgage (P&I)
- −$5,637
- Tax from tax record
- −$558 /mo · $6,692/yr
- Insurance
- −$448
- Flood insurance flood zone
- −$66 /mo · $798/yr
- HOA
- −$0
- Vacancy / Maint / Mgmt
- −$1,810
- Net cashflow
- $100
Break-even live
Sensitivity live
| Price | -10% $709 | -5% $405 | +0% $100 | +5% $-204 | +10% $-508 |
|---|---|---|---|---|---|
| Rent | -10% $-581 | -5% $-240 | +0% $100 | +5% $441 | +10% $781 |
| Rate | -1.0pp $642 | -0.5pp $374 | base $100 | +0.5pp $-178 | +1.0pp $-462 |
4-unit breakdown (identical units grouped — click to expand)
| Units | Beds | Baths | Est. rent |
|---|---|---|---|
| 2× units | 2 | 1 | $4,652 |
| #1 | 2 | 1 | $2,326 |
| #2 | 2 | 1 | $2,326 |
| 2× units | 1 | 1 | $3,968 |
| #3 | 1 | 1 | $1,984 |
| #4 | 1 | 1 | $1,984 |
| Total (4 units) | $8,620 | ||
UW: 25.0% down · 7.5% · 30yr · 1.5% tax · 5.0% vac · 8.0% maint · 8.0% mgmt
Financing live
Cash to close
- Down payment
- $268,750
- Closing costs
- $32,250
- Reserves months
- —
- Total cash needed
- —
Loan-product check · same deal, 3 products live
Conventional
25% down · 7.5% · 30yr
- Down + closing
- —
- Monthly P&I
- —
- Monthly cashflow
- —
- DSCR
- —
- Eligible?
- —
Personal DTI + credit; lowest rate.
DSCR
20% down · 8.5% · 30yr
- Down + closing
- —
- Monthly P&I
- —
- Monthly cashflow
- —
- DSCR
- —
- Eligible?
- —
No personal income docs; deal must DSCR.
Hard money
10% down · 12.0% · 12mo
- Down + closing
- —
- Monthly P&I
- —
- Monthly cashflow
- —
- DSCR
- —
- Eligible?
- —
Short-term bridge; refi at stabilization.
Listing history 12 events
-
2026-06-18days on market $1,075,000 Active 14 DOM
-
2026-06-17days on market $1,075,000 Active 13 DOM
-
2026-06-16days on market $1,075,000 Active 12 DOM
-
2026-06-15days on market $1,075,000 Active 11 DOM
-
2026-06-14days on market $1,075,000 Active 9 DOM
-
2026-06-13days on market $1,075,000 Active 8 DOM
-
2026-06-10days on market $1,075,000 Active 6 DOM
-
2026-06-09days on market $1,075,000 Active 5 DOM
-
2026-06-08days on market $1,075,000 Active 4 DOM
-
2026-06-07days on market $1,075,000 Active 3 DOM
-
2026-06-05remarks 699-char remark
-
2026-06-05$1,075,000 Active 1 DOM
ⓘ Source: listings_history table (triggers on properties + properties_extension) + one-shot
backfill from property_details.listing_events for pre-trigger history.
Tax reassessment forecast CA · Resets to sale price
- Current annual tax
- $6,692 · $558/mo
- Projected year-2 tax
- $8,170 · $681/mo
- Expected delta
- +$1,478/yr (+$123/mo · 22.1%)
ⓘ Screening estimate from a state-policy table — verify with the county assessor before closing.
Climate risk First Street
- Flood 7/10 Severe FEMA zone X (unshaded) · 98% chance over 30 yrs
- Wildfire 5/10 Major
- Heat 4/10 Moderate 7 d/yr ≥92°F today · 15 d/yr by 30 yrs out
- Wind 1/10 Low
- Air quality 8/10 Severe 15 unhealthy d/yr today · 17 by 30 yrs out
Nearby sold comps map
Loading sold comps map…
Walkable amenities ~0.75 mi
Loading nearby amenities…
Taxation est. · year 1
- Rental income
- $103,440
- − Mortgage interest
- −$60,217
- − Property taxes
- −$6,692
- − Insurance
- −$6,172
- − Repairs & maintenance
- −$8,275
- − Management
- −$8,275
- − Depreciation
- −$31,273
- Taxable loss
- −$17,465
- Est. tax savings @ 24.0%
- +$4,192
- After-tax cash flow
- $5,395/yr
For passive investors: Depreciation is non-cash, so a rental often shows a tax loss while cash-flowing — sheltering income. Rental losses are passive: they offset passive income freely, and up to $25,000/yr can offset ordinary (W-2) income if you actively participate and your MAGI is under $100k (phasing out to $0 by $150k); unused losses carry forward. On sale, claimed depreciation is recaptured at up to 25%, and gains may owe capital-gains tax (a 1031 exchange can defer both). Figures are a year-1 estimate at your 24.0% rate — not tax advice; consult a CPA.
Schools (NCES district)
- District
- Santa Rosa High
- NCES district ID
- 0635830
- Math proficiency
- 31% —
- Reading proficiency
- 47% —
- Median HH income
- $62,000
- Composite
- 37.25/100
- National rank
- #8972
- State rank
- #703 of 1400 in CA
Livability — Santa Rosa
- Score
- 75/100
- State rank
- #112
- US rank
- #3940
Category grades
Schools grade is shown separately in the Schools card above.
Census & demographics
- Census place
- Santa Rosa, CA
- County
- Sonoma County · 449,805 people
- City population
- 210,074
- Metro
- Santa Rosa-Petaluma, CA
- Population (ZIP)
- 36,861
- Household income
- $93,615
- Rent vs Own
- Severe rent burden
- 1525.0
Population outlook (Sonoma County) Hauer SSP2
- Today (2025)
- 539,935 people
- By 2030
- 554,870 · +2.8%
- By 2040
- 573,262 · +6.2%
- By 2050
- 580,715 · +7.6%
- By 2075
- 579,229 · +7.3%
- By 2100
- 547,835 · +1.5%
Race, ethnicity, and origin ACS 2023
- Neighborhood character
- Diverse neighborhood (Simpson 0.61)
- Race & ethnicity
- White 46% Hispanic / Latino 41% Two or more races 16% Asian 6% Black 1% Native American 1%
- Hispanic origin (detail)
- Mexican 36%
- Common ancestry
- Lithuanian 2% Italian 2% Slovak 1%
- Foreign-born
- 24% · Canada, Vietnam, China
- Languages at home
- 63% English-only · Spanish 32% Other Indo-European 2% Tagalog/Filipino 1%
Political lean MEDSL · Sonoma
- 2024 margin
- Solid D (+46.2) · D 71.4% · R 25.2% · Other 3.3%
- 2008→2024 swing
- -3.4pp toward R · 2008: 49.6pp · 2024: 46.2pp
- All cycles
- 2024: D+46.2 2020: D+51.5 2016: D+47.9 2012: D+44.9 2008: D+49.6
Not yet ingested
- Civics
- —
Market trends
- HPI YoY
- ▼ -855.56%
- Current HPI
- 253.1061
- Rent YoY
- ▼ -1.37%
- Metro
- Santa Rosa-Petaluma, CA
- State GDP YoY
- ▲ 3.21%
- F500 in state
- 116
Industry mix (Fortune 500 HQ in CA)
| Industry | F500 HQs | Revenue |
|---|---|---|
| Technology | 27 | $1,492B |
|
||
| Financial Services | 3 | $174B |
|
||
| Retail | 3 | $44B |
|
||
| Insurance | 3 | $26B |
|
||
| Media / Entertainment | 2 | $115B |
|
||
| Pharmaceuticals / Biotech | 2 | $62B |
|
||
Price history
+928.7% since first listed8 events — show timeline
- 2026-06-04 Listed $1,075,000 BAREIS
- 2026-02-18 Pending — BAREIS
- 2026-01-23 Contingent — BAREIS
- 2025-12-01 Relisted — BAREIS
- 2025-11-11 Price Changed $1,075,000 BAREIS
- 2025-10-15 Listed $1,100,000 BAREIS
- 2000-08-11 Sold (Public Records) $381,500 Public Records
- 1993-02-26 Sold (Public Records) $104,500 Public Records
Property tax history
+1.7%/yrLatest (2025): $6,692 · +1.5% YoY. Source: county tax records.
Cash-flow waterfall
monthlySold comps — $/sqft
last 12 mo · ≤1 miLoading sold comps…