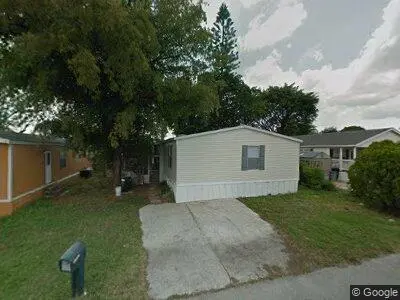
23033 Watergate Cir
Watergate, FL 33428
$280,000C+
3 bd · 2.0 ba ·
1,296 sqft ·
Built 2001
· Manufactured
· Active
· 23 DOM
Cashflow @ list (25.0% down · 7.5%)
Estimated rent
$3,011/mo
Mortgage (P&I)
−$1,468
Tax + insurance
−$271
HOA
−$0
Vac / Maint / Mgmt
−$632
Net cashflow
$640/mo
Annual
$7,677/yr
Cap rate
9.03%
Cash-on-cash
9.79%
DSCR
1.44
1% rule
1.08%
Cash to close
$78,400
Investor read
- This is a 3-bed/2.0-bath manufactured listed at $280k.
- At list price, monthly cash flow is $640 ($8k/yr) — positive.
- The deal already cash-flows at list — no discount required.
- Meets the 1% rule at list price ($3k rent vs $280k).
- It's been on market 23 days — a 2% lower offer ($276k) is reasonable based on typical stale-listing flexibility.
- Recommended offer: $276k (1.5% below list) — sets the bar for market timing.
- Local home prices are declining (-3.0%/yr); year-one equity from $2k of loan paydown is wiped out by about $8k of value loss. Plan a longer hold.
- Location reads 67/100 on livability (#585 in FL) — a middle-class / working-renter tenant base. Strengths: cost of living A+, housing A+, crime A; Watch: schools F, amenities F, commute F.
- Palm Beach (suburban): math 46% / reading 53% proficiency, ranked #34 of 73 in FL (top 47%) — families likely to look elsewhere, expect single-tenant / working-renter base with shorter leases.
- Market conditions: Rents rising (+3.7%/yr); 267 active listings in the ZIP; 40 comparable units currently listed for rent nearby; rentals at typical pace (median 20d on market — plan ~3-4 weeks tenant-placement turnaround); solid renter incomes; 3,974 units permitted in Palm Beach County in 2024 (1,012 in 5+ unit buildings).
- Palm Beach County population projected at +30% by 2050 — long-run rental-demand tailwind backs the buy-and-hold thesis.
- 2 sale attempts since 16y ago with the ask held roughly flat each time — persistent listings suggest the price (not the market) is what's stuck; bring a comps-based counter.
- Current owner paid $95k; list at $280k implies a 195% gain — meaningful room to come down on a strong offer.
- At projected returns (-3.0% appreciation + 3.7% rent growth), your $78k cash investment doubles in ~10 years — after that, you're playing with house money.
- Climate carrying-cost: severe wind risk, 99% chance of damaging wind over 30y; extreme-heat days projected 7→27/yr by 2055 (HVAC capex compounding) — expect insurance premiums to compound above CPI over the hold.
- This rent runs 41% of the median local income ($89k/yr) — at the standard rent-burdened threshold; future hikes will face affordability resistance.
Questions for listing agent
- Is there a deadline driving the sale (1031 exchange, divorce, estate, relocation)? That informs how much negotiation room exists.
- Schools are F-rated, which usually means shorter tenancies and higher turnover. Who's the typical renter profile here, and what's been the actual vacancy rate?
- What's the average days-on-market for RENTAL listings here right now (not sales)? A rising rental-DOM trend means longer vacancies and softer asking-rent achievability than the comps imply.
- What's the recent tenant-quality profile in this submarket — average credit score on applications, eviction rate, late-payment / NSF rate, and stable-employment percentage? A property-management company in the area should have these aggregated.
- How much new for-sale + rental construction is in the pipeline within 1–3 miles? Heavy new supply typically softens prices + rents 12–24 months out; constrained supply supports both.
CashFlowRE · CFR-SSWWS41DHVAY6C
· Data 2 days ago
cashflowre.app · 2026-05-29