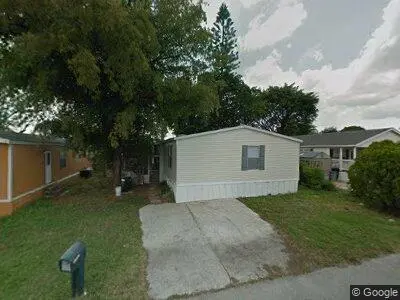
23033 Watergate Cir · Watergate, FL
Flood risk 3/10 · Minor
- FEMA flood zone
- X (unshaded)
- Chance of flooding over 30 yrs
- 0.2%
- Est. flood insurance / yr
- $507 – $1,088
Fire risk 1/10 · Minimal
- Est. fire insurance / yr
- $947 – $1,759
Heat risk 10/10 · Severe
- Hot days now (above 107°F)
- 7 days/yr
- Hot days in 30 yrs
- 27 days/yr
Wind risk 10/10 · Severe
- Chance of severe wind over 30 yrs
- 99.0%
Air-quality risk 3/10 · Minor
- Unhealthy air days now
- 2 days/yr
- Unhealthy air days in 30 yrs
- 3 days/yr
Risk factors via First Street. Map © Google.
Why this score? — see what drove the C+ grade
The composite is a weighted blend of 9 inputs, each scored 0–100. Each bar is that input's sub-score; the figure is the points it added to the 100-point composite (weight × sub-score).
- Cash flow +25.3/30.0
- DSCR +8.4/10.0
- ARV discount +7.5/15.0
- 1% rule +5.8/10.0
- Schools +4.3/10.0
- Rent growth +3.4/5.0
- Livability +3.4/5.0
- Condition / age +2.5/5.0
- Appreciation +0.0/10.0
$280,000
🖨 Deal sheet 📄 Offer letter ✓ Due diligence
Listing remarks MLS
no show until monday 3/29/2010.. . Great deal 3/2 Mobile Home and you own the land!
Key facts
- Built 2001
- Listed 22 days
Neighborhood map
What this means for you Summary
Snapshot
- This is a 3-bed/2.0-bath manufactured listed at $280k.
Deal economics
- At list price, monthly cash flow is $640 ($8k/yr) — positive.
- The deal already cash-flows at list — no discount required.
- Meets the 1% rule at list price ($3k rent vs $280k).
- Recommended offer: $276k (1.5% below list) — sets the bar for market timing.
Location & tenants
- Location reads 67/100 on livability (#585 in FL) — a middle-class / working-renter tenant base. Strengths: cost of living A+, housing A+, crime A; Watch: schools F, amenities F, commute F.
- Palm Beach (suburban): math 46% / reading 53% proficiency, ranked #34 of 73 in FL (top 47%) — families likely to look elsewhere, expect single-tenant / working-renter base with shorter leases.
- Market conditions: Rents rising (+3.7%/yr); 267 active listings in the ZIP; 40 comparable units currently listed for rent nearby; rentals at typical pace (median 20d on market — plan ~3-4 weeks tenant-placement turnaround); solid renter incomes; 3,974 units permitted in Palm Beach County in 2024 (1,012 in 5+ unit buildings).
- This rent runs 41% of the median local income ($89k/yr) — at the standard rent-burdened threshold; future hikes will face affordability resistance.
Forward outlook
- Local home prices are declining (-3.0%/yr); year-one equity from $2k of loan paydown is wiped out by about $8k of value loss. Plan a longer hold.
- Palm Beach County population projected at +30% by 2050 — long-run rental-demand tailwind backs the buy-and-hold thesis.
- At projected returns (-3.0% appreciation + 3.7% rent growth), your $78k cash investment doubles in ~10 years — after that, you're playing with house money.
Negotiation context
- It's been on market 23 days — a 2% lower offer ($276k) is reasonable based on typical stale-listing flexibility.
- 2 sale attempts since 16y ago with the ask held roughly flat each time — persistent listings suggest the price (not the market) is what's stuck; bring a comps-based counter.
- Current owner paid $95k; list at $280k implies a 195% gain — meaningful room to come down on a strong offer.
Risks & watch-outs
- Climate carrying-cost: severe wind risk, 99% chance of damaging wind over 30y; extreme-heat days projected 7→27/yr by 2055 (HVAC capex compounding) — expect insurance premiums to compound above CPI over the hold.
Questions for the listing agent
- Is there a deadline driving the sale (1031 exchange, divorce, estate, relocation)? That informs how much negotiation room exists.
- Schools are F-rated, which usually means shorter tenancies and higher turnover. Who's the typical renter profile here, and what's been the actual vacancy rate?
- What's the average days-on-market for RENTAL listings here right now (not sales)? A rising rental-DOM trend means longer vacancies and softer asking-rent achievability than the comps imply.
- What's the recent tenant-quality profile in this submarket — average credit score on applications, eviction rate, late-payment / NSF rate, and stable-employment percentage? A property-management company in the area should have these aggregated.
- How much new for-sale + rental construction is in the pipeline within 1–3 miles? Heavy new supply typically softens prices + rents 12–24 months out; constrained supply supports both.
Investment metrics
- 1% rule
- 1.08% ✓
- Cap rate
- 9.03%
- Cash-on-cash
- 9.79%
- DSCR
- 1.44
- GRM
- 7.7
CMA / ARV
No comps found within radius.
Projected returns pro-forma
-3.0% appreciation · 3.72% rent growth · sell at horizon
- IRR
- -0.8%
- Equity multiple
- 0.97×
- Total profit
- $-2,504
- Equity at exit
- $41,749
- IRR
- 9.5%
- Equity multiple
- 1.75×
- Total profit
- $59,131
- Equity at exit
- $24,209
Cash invested: $78,400 (down + closing). Projections, not guarantees.
Landlord ↔ Tenant lean methodology
- Overall (STATE)
- 87 Strongly Landlord-Friendly
- State Florida
- 87 Strongly Landlord-Friendly · R+3
- County
- — inherits STATE
- City
- — inherits STATE
ZIP-level market 33428
- Rents YoY
- 3.7%
- Active inventory
- 267
- Price-to-rent
- 7.7×
Monthly cashflow live
- Estimated rent
- $3,011 high interval (Pro) →
- Mortgage (P&I)
- −$1,468
- Tax from tax record
- −$154 /mo · $1,851/yr
- Insurance
- −$117
- HOA
- −$0
- Vacancy / Maint / Mgmt
- −$632
- Net cashflow
- $640
Break-even live
UW: 25.0% down · 7.5% · 30yr · 1.5% tax · 5.0% vac · 8.0% maint · 8.0% mgmt
Financing live
Cash to close
- Down payment
- $70,000
- Closing costs
- $8,400
- Reserves months
- —
- Total cash needed
- —
Loan-product check · same deal, 3 products live
Conventional
25% down · 7.5% · 30yr
- Down + closing
- —
- Monthly P&I
- —
- Monthly cashflow
- —
- DSCR
- —
- Eligible?
- —
Personal DTI + credit; lowest rate.
DSCR
20% down · 8.5% · 30yr
- Down + closing
- —
- Monthly P&I
- —
- Monthly cashflow
- —
- DSCR
- —
- Eligible?
- —
No personal income docs; deal must DSCR.
Hard money
10% down · 12.0% · 12mo
- Down + closing
- —
- Monthly P&I
- —
- Monthly cashflow
- —
- DSCR
- —
- Eligible?
- —
Short-term bridge; refi at stabilization.
Rent comps 40 comps
| Address | Beds | Baths | Sqft | Rent | $/sqft | DOM | Units | Dist |
|---|---|---|---|---|---|---|---|---|
| 11887 Anchorage Way Boca Raton, FL | 2.0 | 2.0 | 960 | $1,900 | $1.98 | 24d | 1 | 0.12mi |
| 22974 Seaspray Pl Boca Raton, FL | 3.0 | 2.0 | 1080 | $2,200 | $2.04 | 12d | 1 | 0.15mi |
| 11942 N Branch Rd Boca Raton, FL | 2.0 | 2.0 | 900 | $1,950 | $2.17 | 24d | 1 | 0.22mi |
| 22776 Neptune Rd Boca Raton, FL | 3.0 | 2.0 | 1288 | $2,900 | $2.25 | 24d | 1 | 0.26mi |
| 6534 NW 80th Dr Parkland, FL | 3.0 | 2.0 | 1661 | $4,500 | $2.71 | 14d | 1 | 0.31mi |
| 23392 Country Club Dr E Boca Raton, FL | 3.0 | 2.0 | 1200 | $3,500 | $2.92 | 18d | 1 | 0.35mi |
| 10457 S 228th Ln Boca Raton, FL | 2.0 | 2.0 | 1104 | $1,900 | $1.72 | 7d | 1 | 0.38mi |
| 11143 Model Cir E Boca Raton, FL | 3.0 | 2.0 | 1116 | $3,350 | $3.00 | 24d | 1 | 0.44mi |
| 10323 Boca Bnd W Unit K4 Boca Raton, FL | 2.0 | 2.0 | 1068 | $2,600 | $2.43 | 24d | 1 | 0.46mi |
| 10267 Boca Bnd W Unit G4 Boca Raton, FL | 2.0 | 2.0 | 1068 | $2,850 | $2.67 | 24d | 1 | 0.52mi |
| 10669 Boca Entrada Blvd Boca Raton, FL | 3.0 | 2.0 | 1083 | $3,450 | $3.19 | 24d | 1 | 0.52mi |
| 22592 Lombard Ave Boca Raton, FL | 4.0 | 2.0 | 1369 | $4,100 | $2.99 | 24d | 1 | 0.54mi |
| 22592 Lombard Ave Boca Raton, FL | 4.0 | 2.0 | 1369 | $4,100 | $2.99 | 2d | 1 | 0.54mi |
| 10234 Sleepy Brook Way Boca Raton, FL | 3.0 | 2.0 | 1552 | $3,500 | $2.26 | 7d | 1 | 0.60mi |
| 10110 Boca Entrada Blvd #305 Boca Raton, FL | 2.0 | 2.0 | 1155 | $2,350 | $2.03 | 3d | 1 | 0.64mi |
| 7525 NW 61st Ter #3103 Parkland, FL | 3.0 | 2.0 | 1760 | $3,200 | $1.82 | 7d | 1 | 0.65mi |
| 10110 Boca Entrada Blvd Boca Raton, FL | 2.0 | 2.0 | 1155 | $2,338 | $2.02 | 4d | 2 | 0.65mi |
| 10110 Boca Entrada Blvd Boca Raton, FL | 2.0 | 2.0 | 1155 | $2,338 | $2.02 | 3d | 2 | 0.65mi |
| 10884 Gantry St Boca Raton, FL | 4.0 | 2.0 | 1356 | $4,200 | $3.10 | 4d | 1 | 0.71mi |
| 9921 Three Lakes Cir Unit 9921 Boca Raton, FL | 3.0 | 2.0 | 967 | $2,700 | $2.79 | 24d | 1 | 0.86mi |
| 22735 SW 66th Ave Boca Raton, FL | 2.0 | 2.0 | 1170 | $2,300 | $1.97 | 5d | 1 | 0.89mi |
| 22618 Vistawood Way Boca Raton, FL | 4.0 | 2.0 | 1668 | $3,400 | $2.04 | 7d | 1 | 0.89mi |
| 7374 NW 61st Ter Parkland, FL | 3.0 | 2.5 | 1776 | $3,750 | $2.11 | 24d | 1 | 0.90mi |
| 10180 Fanfare Dr Unit 10180 Boca Raton, FL | 3.0 | 2.0 | 1266 | $3,800 | $3.00 | 3d | 1 | 0.91mi |
| 10180 Fanfare Dr Unit 10180 Boca Raton, FL | 3.0 | 2.0 | 1266 | $3,800 | $3.00 | 2d | 1 | 0.91mi |
| 22765 SW 66th Ave #204 Boca Raton, FL | 2.0 | 2.0 | 1170 | $3,000 | $2.56 | 24d | 1 | 0.91mi |
| 4538 Albedo St Boca Raton, FL | 3.0 | 2.0 | 1146 | $3,400 | $2.97 | 19d | 1 | 0.94mi |
| 4784 Alfresco St Boca Raton, FL | 4.0 | 2.0 | 1343 | $3,950 | $2.94 | 24d | 1 | 0.94mi |
| 22541 Vistawood Way Boca Raton, FL | 3.0 | 2.0 | 1200 | $2,750 | $2.29 | 24d | 1 | 0.95mi |
| 9973 Three Lakes Cir Boca Raton, FL | 2.0 | 2.0 | 1026 | $2,500 | $2.44 | 24d | 1 | 0.95mi |
| 9993 Three Lakes Cir Boca Raton, FL | 3.0 | 2.0 | 972 | $2,600 | $2.67 | 14d | 1 | 0.96mi |
| 9780 Marina Blvd #415 Boca Raton, FL | 2.0 | 2.0 | 955 | $2,000 | $2.09 | 24d | 1 | 0.97mi |
| 22605 SW 66th Ave #403 Boca Raton, FL | 2.0 | 2.0 | 1030 | $2,100 | $2.04 | 24d | 1 | 0.99mi |
| 9826 Marina Blvd #1027 Boca Raton, FL | 2.0 | 2.0 | 955 | $2,500 | $2.62 | 24d | 1 | 1.00mi |
| 4954 Ataman St Boca Raton, FL | 3.0 | 2.0 | 1819 | $3,600 | $1.98 | 7d | 1 | 1.00mi |
| 11750 Timbers Way Boca Raton, FL | 3.0 | 2.0 | 1200 | $3,150 | $2.62 | 24d | 1 | 1.02mi |
| 22682 Family Cir Unit 22682 Boca Raton, FL | 3.0 | 2.0 | 1425 | $3,400 | $2.39 | 14d | 1 | 1.06mi |
| 22745 SW 65th Way Boca Raton, FL | 3.0 | 2.0 | 1477 | $3,500 | $2.37 | 3d | 1 | 1.06mi |
| 1620 SW 64th Way Unit H Boca Raton, FL | 2.0 | 2.0 | 1008 | $2,250 | $2.23 | 24d | 1 | 1.08mi |
| 5800 NW 74th Pl Coconut Creek, FL | 1.0–2.0 | 1.0–2.0 | 1115 | $2,407 | $2.16 | 2d | 17 | 1.13mi |
Listing history 17 events
-
2026-06-18days on market $280,000 Active 23 DOM
-
2026-06-17days on market $280,000 Active 22 DOM
-
2026-06-16days on market $280,000 Active 21 DOM
-
2026-06-15days on market $280,000 Active 20 DOM
-
2026-06-13days on market $280,000 Active 18 DOM
-
2026-06-09days on market $280,000 Active 14 DOM
-
2026-06-07days on market $280,000 Active 12 DOM
-
2026-06-04days on market $280,000 Active 9 DOM
-
2026-06-03days on market $280,000 Active 8 DOM
-
2026-06-01days on market $280,000 Active 6 DOM
-
2026-05-31days on market $280,000 Active 5 DOM
-
2026-05-26$280,000 Active
-
2018-10-17soldstatus $95,000
-
2011-03-30soldstatus $36,675 83-char remark
Show marketing remark (83 chars)
no show until monday 3/29/2010.. . Great deal 3/2 Mobile Home and you own the land!
-
2010-10-03historical 83-char remark
Show marketing remark (83 chars)
no show until monday 3/29/2010.. . Great deal 3/2 Mobile Home and you own the land!
-
2010-03-19$49,900 83-char remark
Show marketing remark (83 chars)
no show until monday 3/29/2010.. . Great deal 3/2 Mobile Home and you own the land!
-
1991-10-15soldstatus $34,100
ⓘ Source: listings_history table (triggers on properties + properties_extension) + one-shot
backfill from property_details.listing_events for pre-trigger history.
Tax reassessment forecast FL · Resets to sale price
- Current annual tax
- $1,851 · $154/mo
- Projected year-2 tax
- $2,324 · $194/mo
- Expected delta
- +$473/yr (+$39/mo · 25.6%)
ⓘ Screening estimate from a state-policy table — verify with the county assessor before closing.
Climate risk First Street
- Flood 3/10 Moderate FEMA zone X (unshaded) · 20% chance over 30 yrs
- Wildfire 1/10 Low
- Heat 10/10 Extreme 7 d/yr ≥107°F today · 27 d/yr by 30 yrs out
- Wind 10/10 Extreme 99% chance of damaging wind over 30 yrs
- Air quality 3/10 Moderate 2 unhealthy d/yr today · 3 by 30 yrs out
Nearby sold comps map
Loading sold comps map…
Walkable amenities ~0.75 mi
Loading nearby amenities…
Taxation est. · year 1
- Rental income
- $36,136
- − Mortgage interest
- −$15,684
- − Property taxes
- −$1,851
- − Insurance
- −$1,400
- − Repairs & maintenance
- −$2,891
- − Management
- −$2,891
- − Depreciation
- −$8,145
- Taxable income
- $3,274
- Est. tax owed @ 24.0%
- −$786
- After-tax cash flow
- $6,891/yr
For passive investors: Depreciation is non-cash, so a rental often shows a tax loss while cash-flowing — sheltering income. Rental losses are passive: they offset passive income freely, and up to $25,000/yr can offset ordinary (W-2) income if you actively participate and your MAGI is under $100k (phasing out to $0 by $150k); unused losses carry forward. On sale, claimed depreciation is recaptured at up to 25%, and gains may owe capital-gains tax (a 1031 exchange can defer both). Figures are a year-1 estimate at your 24.0% rate — not tax advice; consult a CPA.
Schools (NCES district)
- District
- Palm Beach
- NCES district ID
- 1201500
- Math proficiency
- 46% ▼ -16.00%
- Reading proficiency
- 53% ▼ -4.00%
- Median HH income
- $53,943
- Composite
- 42.72/100
- National rank
- #3160
- State rank
- #34 of 73 in FL
Livability — Watergate
- Score
- 67/100
- State rank
- #585
- US rank
- #11201
Category grades
Schools grade is shown separately in the Schools card above.
Census & demographics
- Census place
- Watergate, FL
- County
- Palm Beach County · 1,438,312 people
- Metro
- Miami-Fort Lauderdale-Pompano Beach, FL
- Population (ZIP)
- 47,588
- Household income
- $88,543
- Rent vs Own
- Severe rent burden
- 1990.0
Population outlook (Palm Beach County) Hauer SSP2
- Today (2025)
- 1,637,487 people
- By 2030
- 1,743,255 · +6.5%
- By 2040
- 1,948,712 · +19.0%
- By 2050
- 2,132,979 · +30.3%
- By 2075
- 2,530,027 · +54.5%
- By 2100
- 2,706,979 · +65.3%
Race, ethnicity, and origin ACS 2023
- Neighborhood character
- Diverse neighborhood (Simpson 0.69)
- Race & ethnicity
- White 50% Two or more races 23% Hispanic / Latino 22% Black 7% Asian 5%
- Hispanic origin (detail)
- Mexican 3% Puerto Rican 3% Cuban 2% Dominican 1%
- Common ancestry
- Estonian 12% Romanian 3% Scotch-Irish 3%
- Foreign-born
- 37% · Canada, Jamaica, Vietnam
- Languages at home
- 55% English-only · Spanish 19% Other Indo-European 17% French/Haitian/Cajun 2%
Political lean MEDSL · Palm Beach
- 2024 margin
- Toss-up / Even · D 50.0% · R 49.2%
- 2008→2024 swing
- -22.1pp toward R · 2008: 22.9pp · 2024: 0.8pp
- All cycles
- 2024: D+0.8 2020: D+12.8 2016: D+15.3 2012: D+17.0 2008: D+22.9
Not yet ingested
- Civics
- —
Market trends
- HPI YoY
- ▼ -299.00%
- Current HPI
- 373.2649
- Rent YoY
- ▲ 3.72%
- Metro
- Miami-Fort Lauderdale-Pompano Beach, FL
- State GDP YoY
- ▲ 3.28%
- F500 in state
- 36
Industry mix (Fortune 500 HQ in FL)
| Industry | F500 HQs | Revenue |
|---|---|---|
| Industrial Technology | 2 | $29B |
|
||
| Insurance | 2 | $17B |
|
||
| Retail | 1 | $60B |
|
||
| Technology Distribution | 1 | $58B |
|
||
| Homebuilding | 1 | $35B |
|
||
| Technology Manufacturing | 1 | $35B |
|
||
Price history
+721.1% since first listed6 events — show timeline
- 2026-05-26 Listed $280,000 FSBO.com
- 2018-10-17 Sold (Public Records) $95,000 Public Records
- 2011-03-30 Sold (MLS) $36,675 Beaches MLS
- 2010-10-03 Listing Removed — Beaches MLS
- 2010-03-19 Listed $49,900 Beaches MLS
- 1991-10-15 Sold (Public Records) $34,100 Public Records
Property tax history
+3.1%/yrLatest (2025): $1,851 · +3.7% YoY. Source: county tax records.
Cash-flow waterfall
monthlySold comps — $/sqft
last 12 mo · ≤1 miLoading sold comps…