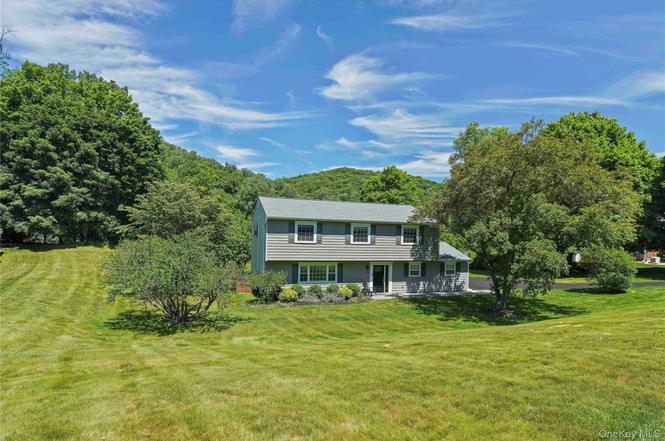
11 Kenneth Dr
Shrub Oak, NY 10579
$689,000F
4 bd · 2.0 ba ·
1,900 sqft ·
Built 1974
· SingleFamily
· Active
· 5 DOM
Cashflow @ list (25.0% down · 7.5%)
Estimated rent
$4,788/mo
Mortgage (P&I)
−$3,613
Tax + insurance
−$1,752
HOA
−$0
Vac / Maint / Mgmt
−$1,006
Net cashflow
$-1,583/mo
Annual
$-18,993/yr
Cap rate
3.65%
Cash-on-cash
-9.43%
DSCR
0.58
1% rule
0.69%
Cash to close
$192,920
Investor read
- This is a 4-bed/2.0-bath single-family listed at $689k.
- At list price, monthly cash flow is $-2k ($-19k/yr) — negative.
- To cash-flow at today's rent, offer at most $409k (40.6% below list).
- To meet the 1% rule (rent ≥ 1% of price), the offer needs to be $479k (30.5% below list).
- Only 5 days on market — expect competitive offers; lowballing is unlikely to land.
- Recommended offer: $409k (40.6% below list) — sets the bar for cash-flow.
- In year one you build about $74k of equity ($5k loan paydown + $69k appreciation (10.0% local appreciation)).
- Location reads 72/100 on livability (#342 in NY) — a middle-class / working-renter tenant base. Strengths: crime A+, employment A+, housing A+; Watch: amenities F, commute F, cost of living F.
- Putnam Valley Central School District (suburban): math 73% / reading 71% proficiency, ranked #91 of 590 in NY (top 15%) — strong family-tenant draw, lease renewals of 3-5y typical; only 12% free/reduced lunch — higher-income household profile.
- Zoned schools: Putnam Valley Elementary School (math 87% / reading 82%, grade A+, #93 of 2,108 statewide, top 6%, 554 students, 19% FRL); Putnam Valley Middle School (math 57% / reading 65%, grade B+, #150 of 729 statewide, top 21%, 473 students, 17% FRL); Putnam Valley High School (math 92% / reading 24%, grade C, #879 of 1,100 statewide, top 80%, 503 students, 23% FRL).
- Watch-outs: flood insurance adds $66/mo.
- Market conditions: 54 active listings in the ZIP; 142 units permitted in Putnam County in 2024 (75 in 5+ unit buildings).
- Putnam County population projected to shrink 3% by 2050 — rents likely to lag national; underwrite the cash flow, not the appreciation.
- 5 sale attempts since 10y ago with the ask held roughly flat each time — persistent listings suggest the price (not the market) is what's stuck; bring a comps-based counter.
- Current owner paid $415k; list at $689k implies a 66% gain — meaningful room to come down on a strong offer.
- By year 2, paydown + projected appreciation supports a ~$118k cash-out refi (75% LTV) — recoverable capital for the next deal without selling this one.
- Climate carrying-cost: severe flood risk; extreme-heat days projected 7→16/yr by 2055 (HVAC capex compounding) — expect insurance premiums to compound above CPI over the hold.
Questions for listing agent
- What do current leases actually rent for vs. the listed asking? Can we see a recent rent roll and the last 12 months of T-12 income?
- Built in 1974 — when were the roof, HVAC, electrical panel, plumbing, and water heater last replaced?
- What's the actual annual flood-insurance premium (NFIP or private), and is the property in a SFHA with mandatory coverage?
- Is there a deadline driving the sale (1031 exchange, divorce, estate, relocation)? That informs how much negotiation room exists.
- Schools are A-rated — typically a magnet for longer-tenancy family renters. What's the average tenant stay here, and is there a school-zone premium baked into asking?
- The area grade is low — what's the realistic commute time and amenity access for the typical tenant pool here? Any planned neighborhood developments (good or bad) we should know about?
- What's the average days-on-market for RENTAL listings here right now (not sales)? A rising rental-DOM trend means longer vacancies and softer asking-rent achievability than the comps imply.
- What's the recent tenant-quality profile in this submarket — average credit score on applications, eviction rate, late-payment / NSF rate, and stable-employment percentage? A property-management company in the area should have these aggregated.
CashFlowRE · CFR-SVHZW77APB1730
· Data 23 h ago
cashflowre.app · 2026-05-29