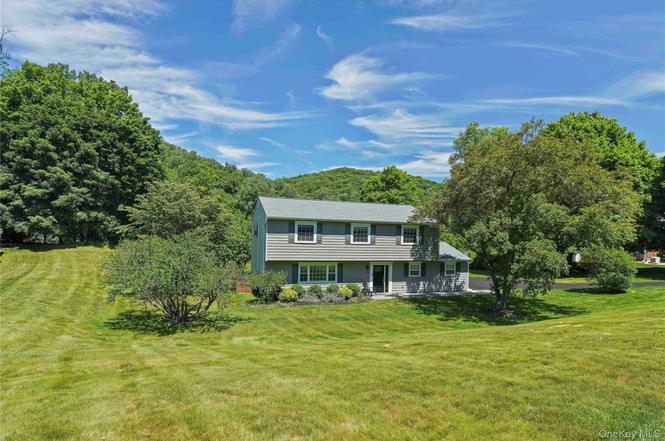
11 Kenneth Dr · Shrub Oak, NY
Flood risk 10/10 · Severe
- FEMA flood zone
- X (shaded)
- Chance of flooding over 30 yrs
- 0.99%
- Est. flood insurance / yr
- $507 – $1,088
Fire risk 3/10 · Minor
- Est. fire insurance / yr
- $691 – $1,283
Heat risk 5/10 · Moderate
- Hot days now (above 98°F)
- 7 days/yr
- Hot days in 30 yrs
- 16 days/yr
Wind risk 4/10 · Minor
- Chance of severe wind over 30 yrs
- 18.0%
Air-quality risk 3/10 · Minor
- Unhealthy air days now
- 2 days/yr
- Unhealthy air days in 30 yrs
- 4 days/yr
Risk factors via First Street. Map © Google.
Why this score? — see what drove the F grade
The composite is a weighted blend of 9 inputs, each scored 0–100. Each bar is that input's sub-score; the figure is the points it added to the 100-point composite (weight × sub-score).
- Appreciation +10.0/10.0
- Schools +6.5/10.0
- Cash flow +5.3/30.0
- Livability +3.6/5.0
- Rent growth +2.5/5.0
- Condition / age +2.5/5.0
- 1% rule +1.9/10.0
- DSCR +0.0/10.0
- ARV discount +0.0/15.0
$689,000
🖨 Deal sheet (PDF) 📄 Offer letter ✓ Due diligence
Listing remarks MLS
Traditional side-hall layout has been opened up on the first floor, and life flows easily through spacious living, dining, and kitchen areas, indoors and out. Whatever the season, whether you are relaxing at the end of a busy day or entertaining a crowd, all you need is here. Upstairs, four bedrooms offer privacy, peace, and quiet. Outside, beyond the beautiful bluestone patio and pool, there’s plenty of space on this one-acre lot for garden and play. Lovingly maintained by one family for more than 30 years, this home features many recent upgrades including Vinyl shake siding and shutters, Earthwise thermal windows, a GAF Timberline Roof, and NEW above-ground oil tank. Freshly painted and with new carpet throughout, this empty nest is ready now to shelter a new Family. Located just over the Westchester County line, convenient to Route 6 and the Taconic State Parkway, and only an hour from NYC --come Home to Putnam, where the country begins.
Key facts
- Modern open layout
- Bbq area
- Updated kitchen
Tags
Property features AI
Exterior
- Parking: Attached garage; 2-car garage; Driveway
- Utilities: Electricity connected (NYSEG); Water connected; Septic tank; Trash collection (public)
- Home design: Single family residence; Updated/remodeled condition; Two levels
- Construction: Vinyl siding; Block and slab foundation
- Exterior features: Back yard; Front yard; Paved areas; Sloped lot; Above-ground outdoor private pool; Pool equipment/cover included; Fuel tank(s)
Interior
- Kitchen: Granite counters; Kitchen island; Stainless steel appliances; Electric oven/range; Oven; Range; Dishwasher; Refrigerator; Electric water heater
- Bedrooms: Total rooms: 9
- Flooring: Carpet; Tile
- Bathrooms: Two full bathrooms; One half bathroom
- Heating & cooling: Baseboard heating; Oil heating; Central air conditioning
- Interior features: Breakfast bar; Eat-in kitchen; Formal dining room; Granite counters; Kitchen island; Walk-through kitchen; Pull-down attic stairs
- Laundry & utility: Washer hookup; Electric dryer hookup; Laundry area in garage; Water softener (owned)
Neighborhood map
What this means for you Summary
Snapshot
- This is a 4-bed/2.0-bath single-family listed at $689k.
Deal economics
- At list price, monthly cash flow is $-2k ($-19k/yr) — negative.
- To cash-flow at today's rent, offer at most $409k (40.6% below list).
- To meet the 1% rule (rent ≥ 1% of price), the offer needs to be $479k (30.5% below list).
- Recommended offer: $409k (40.6% below list) — sets the bar for cash-flow.
Location & tenants
- Location reads 72/100 on livability (#342 in NY) — a middle-class / working-renter tenant base. Strengths: crime A+, employment A+, housing A+; Watch: amenities F, commute F, cost of living F.
- Putnam Valley Central School District (suburban): math 73% / reading 71% proficiency, ranked #91 of 590 in NY (top 15%) — strong family-tenant draw, lease renewals of 3-5y typical; only 12% free/reduced lunch — higher-income household profile.
- Zoned schools: Putnam Valley Elementary School (math 87% / reading 82%, grade A+, #93 of 2,108 statewide, top 6%, 554 students, 19% FRL); Putnam Valley Middle School (math 57% / reading 65%, grade B+, #150 of 729 statewide, top 21%, 473 students, 17% FRL); Putnam Valley High School (math 92% / reading 24%, grade C, #879 of 1,100 statewide, top 80%, 503 students, 23% FRL).
- Market conditions: 54 active listings in the ZIP; 142 units permitted in Putnam County in 2024 (75 in 5+ unit buildings).
Forward outlook
- In year one you build about $74k of equity ($5k loan paydown + $69k appreciation (10.0% local appreciation)).
- Putnam County population projected to shrink 3% by 2050 — rents likely to lag national; underwrite the cash flow, not the appreciation.
- By year 2, paydown + projected appreciation supports a ~$118k cash-out refi (75% LTV) — recoverable capital for the next deal without selling this one.
Negotiation context
- Only 5 days on market — expect competitive offers; lowballing is unlikely to land.
- 5 sale attempts since 10y ago with the ask held roughly flat each time — persistent listings suggest the price (not the market) is what's stuck; bring a comps-based counter.
- Current owner paid $415k; list at $689k implies a 66% gain — meaningful room to come down on a strong offer.
Risks & watch-outs
- Watch-outs: flood insurance adds $66/mo.
- Climate carrying-cost: severe flood risk; extreme-heat days projected 7→16/yr by 2055 (HVAC capex compounding) — expect insurance premiums to compound above CPI over the hold.
Questions for the listing agent
- What do current leases actually rent for vs. the listed asking? Can we see a recent rent roll and the last 12 months of T-12 income?
- Built in 1974 — when were the roof, HVAC, electrical panel, plumbing, and water heater last replaced?
- What's the actual annual flood-insurance premium (NFIP or private), and is the property in a SFHA with mandatory coverage?
- Is there a deadline driving the sale (1031 exchange, divorce, estate, relocation)? That informs how much negotiation room exists.
- Schools are A-rated — typically a magnet for longer-tenancy family renters. What's the average tenant stay here, and is there a school-zone premium baked into asking?
- The area grade is low — what's the realistic commute time and amenity access for the typical tenant pool here? Any planned neighborhood developments (good or bad) we should know about?
- What's the average days-on-market for RENTAL listings here right now (not sales)? A rising rental-DOM trend means longer vacancies and softer asking-rent achievability than the comps imply.
- What's the recent tenant-quality profile in this submarket — average credit score on applications, eviction rate, late-payment / NSF rate, and stable-employment percentage? A property-management company in the area should have these aggregated.
- How much new for-sale + rental construction is in the pipeline within 1–3 miles? Heavy new supply typically softens prices + rents 12–24 months out; constrained supply supports both.
Investment metrics
- 1% rule
- 0.69% ✗
- Cap rate
- 3.65%
- Cash-on-cash
- -9.43%
- DSCR
- 0.58
- GRM
- 12.0
CMA / ARV
- ARV (on-the-fly)
- $573,800
- Comps found
- 1
Show comp detail 1 sale within ~0.75 mi
| Address | Dist | Beds/Ba | Sqft | Sold | Price | $/sf | Match |
|---|---|---|---|---|---|---|---|
| 54 Boswell Rd | 0.21mi | 3/2.0 (-1) | 1,821 (-4%) | 17mo | $550,000 | $302 | 64 |
Match score weights: distance 35% · size 25% · config 20% · recency 20%. Top-matched comps best support the ARV.
Projected returns pro-forma
10.0% appreciation · 3.0% rent growth · sell at horizon
- IRR
- 17.4%
- Equity multiple
- 2.42×
- Total profit
- $274,886
- Equity at exit
- $620,706
- IRR
- 16.4%
- Equity multiple
- 5.61×
- Total profit
- $889,647
- Equity at exit
- $1,338,575
Cash invested: $192,920 (down + closing). Projections, not guarantees.
Landlord ↔ Tenant lean methodology
- Overall (STATE)
- 15 Strongly Tenant-Friendly
- State New York
- 15 Strongly Tenant-Friendly · D+10
- County
- — inherits STATE
- City
- — inherits STATE
ZIP-level market 10579
- Home prices YoY
- 4.0%
- Active inventory
- 54
- Price-to-rent
- 12.0×
Monthly cashflow live
- Estimated rent
- $4,788 medium interval (Pro) →
- Mortgage (P&I)
- −$3,613
- Tax from tax record
- −$1,399 /mo · $16,786/yr
- Insurance
- −$287
- Flood insurance flood zone
- −$66 /mo · $798/yr
- HOA
- −$0
- Vacancy / Maint / Mgmt
- −$1,006
- Net cashflow
- $-1,583
Break-even live
Sensitivity live
| Price | -10% $-1,193 | -5% $-1,388 | +0% $-1,583 | +5% $-1,778 | +10% $-1,973 |
|---|---|---|---|---|---|
| Rent | -10% $-1,961 | -5% $-1,772 | +0% $-1,583 | +5% $-1,394 | +10% $-1,204 |
| Rate | -1.0pp $-1,236 | -0.5pp $-1,408 | base $-1,583 | +0.5pp $-1,761 | +1.0pp $-1,943 |
UW: 25.0% down · 7.5% · 30yr · 1.5% tax · 5.0% vac · 8.0% maint · 8.0% mgmt
Financing live
Cash to close
- Down payment
- $172,250
- Closing costs
- $20,670
- Reserves months
- —
- Total cash needed
- —
Loan-product check · same deal, 3 products live
Conventional
25% down · 7.5% · 30yr
- Down + closing
- —
- Monthly P&I
- —
- Monthly cashflow
- —
- DSCR
- —
- Eligible?
- —
Personal DTI + credit; lowest rate.
DSCR
20% down · 8.5% · 30yr
- Down + closing
- —
- Monthly P&I
- —
- Monthly cashflow
- —
- DSCR
- —
- Eligible?
- —
No personal income docs; deal must DSCR.
Hard money
10% down · 12.0% · 12mo
- Down + closing
- —
- Monthly P&I
- —
- Monthly cashflow
- —
- DSCR
- —
- Eligible?
- —
Short-term bridge; refi at stabilization.
Listing history 5 events
-
2026-06-21days on market $689,000 Active 5 DOM
-
2026-06-18days on market $689,000 Active 2 DOM
-
2026-06-17remarks 688-char remark
-
2026-06-16remarks 664-char remark
-
2026-06-16$689,000 Active 1 DOM
ⓘ Source: listings_history table (triggers on properties + properties_extension) + one-shot
backfill from property_details.listing_events for pre-trigger history.
Tax reassessment forecast NY · Partial reset (capped growth)
- Current annual tax
- $16,786 · $1,399/mo
- Projected year-2 tax
- $16,786 · $1,399/mo
- Expected delta
- $0/yr ($0/mo · 0.0%)
ⓘ Screening estimate from a state-policy table — verify with the county assessor before closing.
Climate risk First Street
- Flood 10/10 Extreme FEMA zone X (shaded) · 99% chance over 30 yrs
- Wildfire 3/10 Moderate
- Heat 5/10 Major 7 d/yr ≥98°F today · 16 d/yr by 30 yrs out
- Wind 4/10 Moderate 18% chance of damaging wind over 30 yrs
- Air quality 3/10 Moderate 2 unhealthy d/yr today · 4 by 30 yrs out
Nearby sold comps map
Loading sold comps map…
Walkable amenities ~0.75 mi
Loading nearby amenities…
Taxation est. · year 1
- Rental income
- $57,460
- − Mortgage interest
- −$38,595
- − Property taxes
- −$16,786
- − Insurance
- −$4,242
- − Repairs & maintenance
- −$4,597
- − Management
- −$4,597
- − Depreciation
- −$20,044
- Taxable loss
- −$31,400
- Est. tax savings @ 24.0%
- +$7,536
- After-tax cash flow
- $-11,457/yr
For passive investors: Depreciation is non-cash, so a rental often shows a tax loss while cash-flowing — sheltering income. Rental losses are passive: they offset passive income freely, and up to $25,000/yr can offset ordinary (W-2) income if you actively participate and your MAGI is under $100k (phasing out to $0 by $150k); unused losses carry forward. On sale, claimed depreciation is recaptured at up to 25%, and gains may owe capital-gains tax (a 1031 exchange can defer both). Figures are a year-1 estimate at your 24.0% rate — not tax advice; consult a CPA.
Schools (NCES district)
- District
- Putnam Valley Central School District
- NCES district ID
- 3624000
- Math proficiency
- 73% ▬ 0.00%
- Reading proficiency
- 71% ▲ 6.00%
- Median HH income
- $94,086
- Composite
- 65.26/100
- National rank
- #491
- State rank
- #91 of 590 in NY
Livability — Shrub Oak
- Score
- 72/100
- State rank
- #342
- US rank
- #5781
Category grades
Schools grade is shown separately in the Schools card above.
Census & demographics
- City population
- 3,081
- Population (ZIP)
- 8,825
Population outlook (Putnam County) Hauer SSP2
- Today (2025)
- 99,705 people
- By 2030
- 99,650 · -0.1%
- By 2040
- 98,641 · -1.1%
- By 2050
- 96,348 · -3.4%
- By 2075
- 94,412 · -5.3%
- By 2100
- 88,728 · -11.0%
Race, ethnicity, and origin ACS 2023
- Neighborhood character
- Predominantly White (77%)
- Race & ethnicity
- White 77% Hispanic / Latino 16% Two or more races 6% Asian 3% Black 2%
- Hispanic origin (detail)
- Puerto Rican 8%
- Common ancestry
- Iranian 3% Romanian 3% Italian 2%
- Foreign-born
- 10% · Canada
- Languages at home
- 83% English-only · Spanish 9% Arabic 3% Other Indo-European 2%
Political lean MEDSL · Putnam
- 2024 margin
- R (+13.7) · D 43.2% · R 56.8%
- 2008→2024 swing
- -6.2pp toward R · 2008: -7.5pp · 2024: -13.7pp
- All cycles
- 2024: R+13.7 2020: R+7.9 2016: R+17.8 2012: R+11.2 2008: R+7.5
Not yet ingested
- Civics
- —
Market trends
- HPI YoY
- ▲ 10.42%
- Current HPI
- 269.3211
- Rent YoY
- —
- Metro
- —
- State GDP YoY
- ▲ 2.60%
- F500 in state
- 92
Industry mix (Fortune 500 HQ in NY)
| Industry | F500 HQs | Revenue |
|---|---|---|
| Financial Services | 10 | $950B |
|
||
| Consumer Goods | 9 | $162B |
|
||
| Insurance | 4 | $225B |
|
||
| Telecommunications | 2 | $144B |
|
||
| Pharmaceuticals | 2 | $112B |
|
||
| Media / Entertainment | 2 | $69B |
|
||
Price history
+1175.9% since first listed16 events — show timeline
- 2026-06-16 Listed $689,000 OneKey® MLS as Distributed by MLS Grid
- 2018-10-09 Listing Removed — OneKey® MLS as Distributed by MLS Grid
- 2018-10-02 Listed $449,000 OneKey® MLS as Distributed by MLS Grid
- 2017-01-20 Sold (Public Records) $415,000 Public Records
- 2017-01-20 Sold (Public Records) $415,000 Public Records
- 2017-01-06 Price Changed $415,000 HGMLS
- 2017-01-06 Sold (MLS) $415,000 HGMLS
- 2017-01-06 Sold (MLS) $415,000 OneKey® MLS as Distributed by MLS Grid
- 2016-10-27 Contingent — HGMLS
- 2016-10-27 Price Changed $423,500 HGMLS
- 2016-08-17 Relisted — HGMLS
- 2016-07-14 Contingent — HGMLS
- 2016-05-20 Listed $423,500 HGMLS
- 2016-05-20 Listed $423,500 OneKey® MLS as Distributed by MLS Grid
- 1985-11-19 Sold (Public Records) $152,000 Public Records
- 1975-03-07 Sold (Public Records) $54,000 Public Records
Property tax history
+11.9%/yrLatest (2025): $16,786 · +2.8% YoY. Source: county tax records.
Cash-flow waterfall
monthlySold comps — $/sqft
last 12 mo · ≤1 miLoading sold comps…