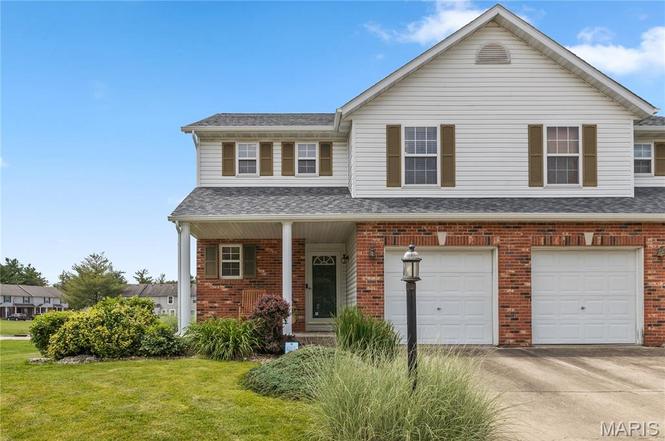
124 Northbay Ct
Glen Carbon, IL 62034
$225,000D+
3 bd · 2.0 ba ·
1,672 sqft ·
Built 1999
· SingleFamily
· Pending
· 6 DOM
Cashflow @ list (25.0% down · 7.5%)
Estimated rent
$1,910/mo
Mortgage (P&I)
−$1,180
Tax + insurance
−$310
HOA
−$0
Vac / Maint / Mgmt
−$401
Net cashflow
$18/mo
Annual
$219/yr
Cap rate
6.39%
Cash-on-cash
0.35%
DSCR
1.02
1% rule
0.85%
Cash to close
$63,000
Investor read
- This is a 3-bed/2.0-bath single-family listed at $225k.
- At list price, monthly cash flow is $18 ($219/yr) — positive.
- The deal already cash-flows at list — no discount required.
- To meet the 1% rule (rent ≥ 1% of price), the offer needs to be $191k (15.1% below list).
- Only 6 days on market — expect competitive offers; lowballing is unlikely to land.
- Recommended offer: $191k (15.1% below list) — sets the bar for 1% rule.
- Local home prices are declining (-3.0%/yr); year-one equity from $2k of loan paydown is wiped out by about $7k of value loss. Plan a longer hold.
- Location reads 75/100 on livability (#236 in IL, #4,344 nationally) — a middle-class / working-renter tenant base. Strengths: crime A+, employment A+, housing A+; Watch: amenities F, commute F, health & safety F.
- Edwardsville CUSD 7 (suburban): math 39% / reading 36% proficiency, ranked #142 of 620 in IL (top 23%) — families likely to look elsewhere, expect single-tenant / working-renter base with shorter leases; only 16% free/reduced lunch — higher-income household profile.
- Zoned schools: Woodland Elementary School (math 40% / reading 33%, grade F, #497 of 2,056 statewide, top 24%, 431 students, 0% FRL); Lincoln Middle School (math 37% / reading 33%, grade F, #191 of 665 statewide, top 30%, 818 students, 0% FRL); Edwardsville High School (math 40% / reading 45%, grade F, #73 of 693 statewide, top 11%, 2,354 students, 0% FRL) — zoned schools average 0% FRL vs 16% district-wide (16 pts lower); this property's tenant base skews higher-income than the district average.
- Market conditions: 118 active listings in the ZIP; 6 comparable units currently listed for rent nearby; rentals at typical pace (median 24d on market — plan ~3-4 weeks tenant-placement turnaround); solid renter incomes; 336 units permitted in Madison County in 2024 (0 in 5+ unit buildings).
- Madison County population projected at -18% by 2050 — secular population decline; favor cash flow + early exit over multi-decade hold.
- Climate carrying-cost: extreme-heat days projected 7→20/yr by 2055 (HVAC capex compounding) — expect insurance premiums to compound above CPI over the hold.
- Cap rate 6.4% vs local median 2.1% in Glen Carbon — top-decile yield for the area; either an underpriced asset or a hidden risk that comps aren't pricing in. Stress-test before assuming the spread holds.
Questions for listing agent
- Is there a deadline driving the sale (1031 exchange, divorce, estate, relocation)? That informs how much negotiation room exists.
- Schools are B-rated — typically a magnet for longer-tenancy family renters. What's the average tenant stay here, and is there a school-zone premium baked into asking?
- The area grade is low — what's the realistic commute time and amenity access for the typical tenant pool here? Any planned neighborhood developments (good or bad) we should know about?
- What's the average days-on-market for RENTAL listings here right now (not sales)? A rising rental-DOM trend means longer vacancies and softer asking-rent achievability than the comps imply.
- What's the recent tenant-quality profile in this submarket — average credit score on applications, eviction rate, late-payment / NSF rate, and stable-employment percentage? A property-management company in the area should have these aggregated.
- How much new for-sale + rental construction is in the pipeline within 1–3 miles? Heavy new supply typically softens prices + rents 12–24 months out; constrained supply supports both.
CashFlowRE · CFR-SWKB065RNJ92EH
· Data 1 day ago
cashflowre.app · 2026-05-29