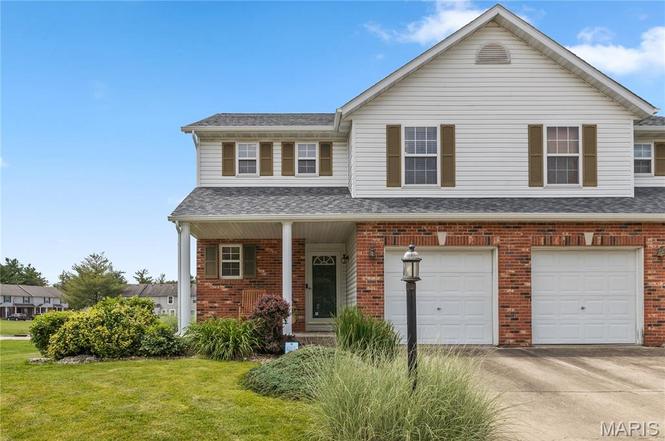
124 Northbay Ct · Glen Carbon, IL
Flood risk 1/10 · Minimal
- FEMA flood zone
- —
- Chance of flooding over 30 yrs
- 0.0%
- Est. flood insurance / yr
- —
Fire risk 1/10 · Minimal
- Est. fire insurance / yr
- $804 – $1,492
Heat risk 5/10 · Moderate
- Hot days now (above 108°F)
- 7 days/yr
- Hot days in 30 yrs
- 20 days/yr
Wind risk 2/10 · Minimal
- Chance of severe wind over 30 yrs
- 1.0%
Air-quality risk 3/10 · Minor
- Unhealthy air days now
- 3 days/yr
- Unhealthy air days in 30 yrs
- 5 days/yr
Risk factors via First Street. Map © Google.
Why this score? — see what drove the D+ grade
The composite is a weighted blend of 9 inputs, each scored 0–100. Each bar is that input's sub-score; the figure is the points it added to the 100-point composite (weight × sub-score).
- ARV discount +15.0/15.0
- Cash flow +13.7/30.0
- DSCR +4.2/10.0
- Livability +3.8/5.0
- 1% rule +3.5/10.0
- Schools +3.5/10.0
- Rent growth +2.5/5.0
- Condition / age +2.5/5.0
- Appreciation +0.0/10.0
$225,000
🖨 Deal sheet (PDF) 📄 Offer letter ✓ Due diligence
Listing remarks
Welcome to your dream home in the heart of Glen Carbon! This charming two-story attached villa is perfectly situated right off Highway 159, providing you with easy access to all the amenities the area has to offer. Property Features: • Bedrooms & Baths: Enjoy two spacious bedrooms and four well-appointed baths, ensuring comfort and convenience for you and your guests. • Versatile Spaces: A cozy loft area provides the perfect space for a reading nook or play area, while the dedicated family room or office offers flexibility for your lifestyle needs. • Gourmet Kitchen: The full kitchen comes equipped with all appliances, making meal prep a breeze. It’s designed for
Key facts
- Heart of glen carbon
- Gourmet kitchen
- Move in ready
Tags
Property features AI
Exterior
- Parking: Attached garage (1 car)
- Utilities: Public water; Public sewer; Electric service by Ameren; Electricity connected, sewer connected, water connected
- Home design: Attached single-family residence; Two-story; Living area 2,081 (public records); Above-grade finished area 1,512 (public records); Below-grade finished area 569
- Construction: Brick and vinyl siding exterior; Architectural shingle roof
- Exterior features: Front porch; Patio; Back yard; Front yard
Interior
- Bedrooms: 2 bedrooms (both on upper level)
- Bathrooms: 3 full bathrooms; 1 half bathroom (main level)
- Heating & cooling: Natural gas heating; Central air conditioning
- Interior features: Full basement; Two levels; 10 total rooms
Neighborhood map
What this means for you Summary
Snapshot
- This is a 3-bed/2.0-bath single-family listed at $225k.
Deal economics
- At list price, monthly cash flow is $18 ($219/yr) — positive.
- The deal already cash-flows at list — no discount required.
- To meet the 1% rule (rent ≥ 1% of price), the offer needs to be $191k (15.1% below list).
- Recommended offer: $191k (15.1% below list) — sets the bar for 1% rule.
- Cap rate 6.4% vs local median 2.1% in Glen Carbon — top-decile yield for the area; either an underpriced asset or a hidden risk that comps aren't pricing in. Stress-test before assuming the spread holds.
Location & tenants
- Location reads 75/100 on livability (#236 in IL, #4,344 nationally) — a middle-class / working-renter tenant base. Strengths: crime A+, employment A+, housing A+; Watch: amenities F, commute F, health & safety F.
- Edwardsville CUSD 7 (suburban): math 39% / reading 36% proficiency, ranked #142 of 620 in IL (top 23%) — families likely to look elsewhere, expect single-tenant / working-renter base with shorter leases; only 16% free/reduced lunch — higher-income household profile.
- Zoned schools: Woodland Elementary School (math 40% / reading 33%, grade F, #497 of 2,056 statewide, top 24%, 431 students, 0% FRL); Lincoln Middle School (math 37% / reading 33%, grade F, #191 of 665 statewide, top 30%, 818 students, 0% FRL); Edwardsville High School (math 40% / reading 45%, grade F, #73 of 693 statewide, top 11%, 2,354 students, 0% FRL) — zoned schools average 0% FRL vs 16% district-wide (16 pts lower); this property's tenant base skews higher-income than the district average.
- Market conditions: 118 active listings in the ZIP; 6 comparable units currently listed for rent nearby; rentals at typical pace (median 24d on market — plan ~3-4 weeks tenant-placement turnaround); solid renter incomes; 336 units permitted in Madison County in 2024 (0 in 5+ unit buildings).
Forward outlook
- Local home prices are declining (-3.0%/yr); year-one equity from $2k of loan paydown is wiped out by about $7k of value loss. Plan a longer hold.
- Madison County population projected at -18% by 2050 — secular population decline; favor cash flow + early exit over multi-decade hold.
Negotiation context
- Only 6 days on market — expect competitive offers; lowballing is unlikely to land.
Risks & watch-outs
- Climate carrying-cost: extreme-heat days projected 7→20/yr by 2055 (HVAC capex compounding) — expect insurance premiums to compound above CPI over the hold.
Questions for the listing agent
- Is there a deadline driving the sale (1031 exchange, divorce, estate, relocation)? That informs how much negotiation room exists.
- Schools are B-rated — typically a magnet for longer-tenancy family renters. What's the average tenant stay here, and is there a school-zone premium baked into asking?
- The area grade is low — what's the realistic commute time and amenity access for the typical tenant pool here? Any planned neighborhood developments (good or bad) we should know about?
- What's the average days-on-market for RENTAL listings here right now (not sales)? A rising rental-DOM trend means longer vacancies and softer asking-rent achievability than the comps imply.
- What's the recent tenant-quality profile in this submarket — average credit score on applications, eviction rate, late-payment / NSF rate, and stable-employment percentage? A property-management company in the area should have these aggregated.
- How much new for-sale + rental construction is in the pipeline within 1–3 miles? Heavy new supply typically softens prices + rents 12–24 months out; constrained supply supports both.
Investment metrics
- 1% rule
- 0.85% ✗
- Cap rate
- 6.39%
- Cash-on-cash
- 0.35%
- DSCR
- 1.02
- GRM
- 9.8
CMA / ARV
- ARV (on-the-fly)
- $279,224
- Comps found
- 12
Show comp detail 12 sales within ~0.75 mi
| Address | Dist | Beds/Ba | Sqft | Sold | Price | $/sf | Match |
|---|---|---|---|---|---|---|---|
| 107 Bayhill Blvd | 0.06mi | 3/2.0 | 1,831 (+10%) | 5mo | $269,900 | $147 | 77 |
| 100 Bayhill Blvd | 0.04mi | 2/2.0 (-1) | 1,776 (+6%) | 7mo | $240,000 | $135 | 77 |
| 6 Shingle Oaks Dr | 0.38mi | 3/2.0 | 1,650 (-1%) | 10mo | $275,000 | $167 | 71 |
| 120 Bayfield Dr | 0.20mi | 4/2.5 (+1) | 1,779 (+6%) | 17mo | $299,900 | $169 | 59 |
| 35 & 36 S Meadow Ln | 0.57mi | 3/2.0 | 1,794 (+7%) | 7mo | $239,000 | $133 | 56 |
| 334 Glen Carbon Rd | 0.56mi | 2/1.5 (-1) | 1,677 (+0%) | 13mo | $200,000 | $119 | 55 |
| 138 Bayfield Dr | 0.31mi | 4/3.0 (+1) | 1,770 (+6%) | 17mo | $289,900 | $164 | 53 |
| 123 Bayfield Dr | 0.22mi | 3/2.0 | 1,440 (-14%) | 18mo | $265,000 | $184 | 52 |
| 2709 Hunters Crossing Dr | 0.69mi | 3/2.0 | 1,780 (+6%) | 8mo | $325,000 | $183 | 50 |
| 78 Depot Dr | 0.62mi | 3/2.5 | 1,810 (+8%) | 11mo | $270,000 | $149 | 46 |
| 3 Crabapple Ln | 0.57mi | 2/2.0 (-1) | 1,492 (-11%) | 10mo | $255,000 | $171 | 42 |
| 42 Old Orchard Ln | 0.55mi | 2/2.0 (-1) | 1,446 (-14%) | 14mo | $250,000 | $173 | 36 |
Match score weights: distance 35% · size 25% · config 20% · recency 20%. Top-matched comps best support the ARV.
Projected returns pro-forma
-3.0% appreciation · 3.0% rent growth · sell at horizon
- IRR
- -15.8%
- Equity multiple
- 0.44×
- Total profit
- $-35,309
- Equity at exit
- $33,548
- IRR
- -7.3%
- Equity multiple
- 0.54×
- Total profit
- $-29,294
- Equity at exit
- $19,454
Cash invested: $63,000 (down + closing). Projections, not guarantees.
Landlord ↔ Tenant lean methodology
- Overall (STATE)
- 43 Moderately Tenant-Leaning
- State Illinois
- 43 Moderately Tenant-Leaning · D+7
- County
- — inherits STATE
- City
- — inherits STATE
ZIP-level market 62034
- Home prices YoY
- -13.7%
- Active inventory
- 118
- Price-to-rent
- 9.8×
Monthly cashflow live
- Estimated rent
- $1,910 high interval (Pro) →
- Mortgage (P&I)
- −$1,180
- Tax from tax record
- −$217 /mo · $2,600/yr
- Insurance
- −$94
- HOA
- −$0
- Vacancy / Maint / Mgmt
- −$401
- Net cashflow
- $18
Break-even live
Sensitivity live
| Price | -10% $146 | -5% $82 | +0% $18 | +5% $-45 | +10% $-109 |
|---|---|---|---|---|---|
| Rent | -10% $-133 | -5% $-57 | +0% $18 | +5% $94 | +10% $169 |
| Rate | -1.0pp $132 | -0.5pp $75 | base $18 | +0.5pp $-40 | +1.0pp $-99 |
UW: 25.0% down · 7.5% · 30yr · 1.5% tax · 5.0% vac · 8.0% maint · 8.0% mgmt
Financing live
Cash to close
- Down payment
- $56,250
- Closing costs
- $6,750
- Reserves months
- —
- Total cash needed
- —
Loan-product check · same deal, 3 products live
Conventional
25% down · 7.5% · 30yr
- Down + closing
- —
- Monthly P&I
- —
- Monthly cashflow
- —
- DSCR
- —
- Eligible?
- —
Personal DTI + credit; lowest rate.
DSCR
20% down · 8.5% · 30yr
- Down + closing
- —
- Monthly P&I
- —
- Monthly cashflow
- —
- DSCR
- —
- Eligible?
- —
No personal income docs; deal must DSCR.
Hard money
10% down · 12.0% · 12mo
- Down + closing
- —
- Monthly P&I
- —
- Monthly cashflow
- —
- DSCR
- —
- Eligible?
- —
Short-term bridge; refi at stabilization.
Rent comps 6 comps
| Address | Beds | Baths | Sqft | Rent | $/sqft | DOM | Units | Dist |
|---|---|---|---|---|---|---|---|---|
| 2 Berry Patch Ln Glen Carbon, IL | 2.0 | 2.0 | 1328 | $1,950 | $1.47 | 25d | 1 | 0.59mi |
| 18 Crabapple Ln Glen Carbon, IL | 2.0 | 2.0 | 1200 | $1,950 | $1.62 | 23d | 1 | 0.61mi |
| 9 Jason Dr Glen Carbon, IL | 3.0 | 3.0 | 1770 | $2,600 | $1.47 | 0d | 1 | 1.06mi |
| 92 Magnolia Dr Glen Carbon, IL | 1.0–3.0 | 1.0–2.0 | 1012 | $2,400 | $2.37 | 0d | 1 | 1.26mi |
| 11 S Cherry Hls Edwardsville, IL | 2.0–3.0 | 1.0–2.5 | 1450 | $2,299 | $1.59 | 0d | 44 | 1.32mi |
| 1040 University Dr Unit 10 Edwardsville, IL | 2.0 | 2.0 | 1215 | $1,495 | $1.23 | 46d | 1 | 1.35mi |
Listing history 7 events
-
2026-06-21statusdays on market $225,000 Pending 6 DOM
-
2026-06-18days on market $225,000 Active 4 DOM
-
2026-06-17days on market $225,000 Active 3 DOM
-
2026-06-16days on market $225,000 Active 2 DOM
-
2026-06-15statusdays on market $225,000 Active 1 DOM
-
2026-06-13remarks 674-char remark
-
2026-06-13$225,000 Coming Soon 2 DOM
ⓘ Source: listings_history table (triggers on properties + properties_extension) + one-shot
backfill from property_details.listing_events for pre-trigger history.
Tax reassessment forecast IL · Partial reset (capped growth)
- Current annual tax
- $2,600 · $217/mo
- Projected year-2 tax
- $3,854 · $321/mo
- Expected delta
- +$1,254/yr (+$104/mo · 48.2%)
ⓘ Screening estimate from a state-policy table — verify with the county assessor before closing.
Climate risk First Street
- Flood 1/10 Low 0% chance over 30 yrs
- Wildfire 1/10 Low
- Heat 5/10 Major 7 d/yr ≥108°F today · 20 d/yr by 30 yrs out
- Wind 2/10 Low 100% chance of damaging wind over 30 yrs
- Air quality 3/10 Moderate 3 unhealthy d/yr today · 5 by 30 yrs out
Nearby sold comps map
Loading sold comps map…
Walkable amenities ~0.75 mi
Loading nearby amenities…
Taxation est. · year 1
- Rental income
- $22,915
- − Mortgage interest
- −$12,603
- − Property taxes
- −$2,600
- − Insurance
- −$1,125
- − Repairs & maintenance
- −$1,833
- − Management
- −$1,833
- − Depreciation
- −$6,545
- Taxable loss
- −$3,625
- Est. tax savings @ 24.0%
- +$870
- After-tax cash flow
- $1,089/yr
For passive investors: Depreciation is non-cash, so a rental often shows a tax loss while cash-flowing — sheltering income. Rental losses are passive: they offset passive income freely, and up to $25,000/yr can offset ordinary (W-2) income if you actively participate and your MAGI is under $100k (phasing out to $0 by $150k); unused losses carry forward. On sale, claimed depreciation is recaptured at up to 25%, and gains may owe capital-gains tax (a 1031 exchange can defer both). Figures are a year-1 estimate at your 24.0% rate — not tax advice; consult a CPA.
Schools (NCES district)
- District
- Edwardsville CUSD 7
- NCES district ID
- 1713530
- Math proficiency
- 39% ▼ -12.00%
- Reading proficiency
- 36% ▼ -17.00%
- Median HH income
- $72,131
- Composite
- 34.56/100
- National rank
- #5169
- State rank
- #142 of 620 in IL
Livability — Glen Carbon
- Score
- 75/100
- State rank
- #236
- US rank
- #4344
Category grades
Schools grade is shown separately in the Schools card above.
Census & demographics
- Census place
- Glen Carbon, IL
- County
- Madison County · 189,064 people
- City population
- 14,870
- Metro
- St. Louis, MO-IL
- Population (ZIP)
- 14,870
- Household income
- $101,260
- Rent vs Own
- Severe rent burden
- 153.0
Population outlook (Madison County) Hauer SSP2
- Today (2025)
- 258,371 people
- By 2030
- 251,523 · -2.7%
- By 2040
- 233,640 · -9.6%
- By 2050
- 213,042 · -17.5%
- By 2075
- 165,255 · -36.0%
- By 2100
- 123,953 · -52.0%
Race, ethnicity, and origin ACS 2023
- Neighborhood character
- Predominantly White (83%)
- Race & ethnicity
- White 83% Black 8% Two or more races 5% Hispanic / Latino 4%
- Common ancestry
- Romanian 4% Lithuanian 4% Italian 3%
- Foreign-born
- 2% · Canada, China
- Languages at home
- 97% English-only · Spanish 1%
Political lean MEDSL · Madison
- 2024 margin
- R (+13.3) · D 42.5% · R 55.8% · Other 1.8%
- 2008→2024 swing
- -22.5pp toward R · 2008: 9.2pp · 2024: -13.3pp
- All cycles
- 2024: R+13.3 2020: R+13.2 2016: R+15.6 2012: R+1.4 2008: D+9.2
Not yet ingested
- Civics
- —
Market trends
- HPI YoY
- ▼ -37.33%
- Current HPI
- 235.3221
- Rent YoY
- —
- Metro
- St. Louis, MO-IL
- State GDP YoY
- ▲ 1.59%
- F500 in state
- 60
Industry mix (Fortune 500 HQ in IL)
| Industry | F500 HQs | Revenue |
|---|---|---|
| Insurance | 4 | $201B |
|
||
| Consumer Goods | 4 | $87B |
|
||
| Industrial Machinery | 3 | $64B |
|
||
| Healthcare | 2 | $55B |
|
||
| Retail / Pharmacy | 1 | $148B |
|
||
| Agriculture / Food | 1 | $86B |
|
||
Price history
1 event — show timeline
- 2026-06-12 Coming Soon $225,000 MARIS as Distributed by MLS Grid
Property tax history
-1.4%/yrLatest (2024): $2,600 · -2.6% YoY. Source: county tax records.
Cash-flow waterfall
monthlySold comps — $/sqft
last 12 mo · ≤1 miLoading sold comps…