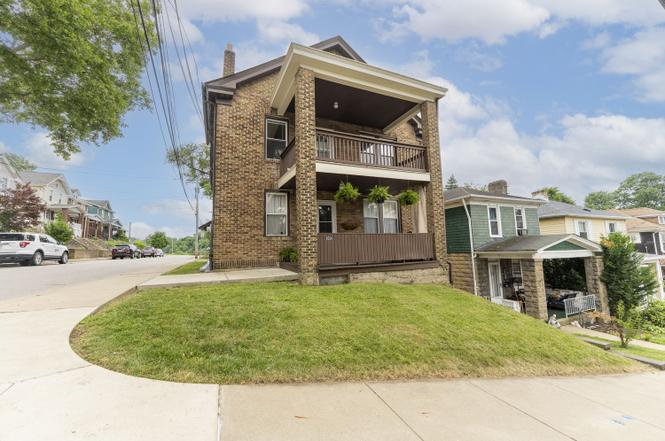
3031 Pinehurst Ave
Dormont, PA 15216
$350,000D
6 bd · 2.0 ba ·
2,552 sqft ·
Built 1935
· MultiFamily
· Active
· 4 DOM
Cashflow @ list (25.0% down · 7.5%)
Estimated rent
$3,269/mo
Mortgage (P&I)
−$1,835
Tax + insurance
−$702
HOA
−$0
Vac / Maint / Mgmt
−$686
Net cashflow
$45/mo
Annual
$537/yr
Cap rate
6.45%
Cash-on-cash
0.55%
DSCR
1.02
1% rule
0.93%
Cash to close
$98,000
Investor read
- This is a 2 × 3-bed/1.0-bath units multifamily listed at $350k.
- At list price, monthly cash flow is $45 ($537/yr) — positive. Per door: $22/mo.
- The deal already cash-flows at list — no discount required.
- To meet the 1% rule (rent ≥ 1% of price), the offer needs to be $327k (6.6% below list).
- Only 4 days on market — expect competitive offers; lowballing is unlikely to land.
- Recommended offer: $327k (6.6% below list) — sets the bar for 1% rule.
- Local home prices are declining (-3.0%/yr); year-one equity from $2k of loan paydown is wiped out by about $10k of value loss. Plan a longer hold.
- Location reads 95/100 on livability (#1 in PA, #1 nationally) — a professional / high-income tenant draw. Strengths: crime A+, amenities A+, commute A+.
- Keystone Oaks SD (suburban): math 45% / reading 65% proficiency, ranked #116 of 539 in PA (top 22%) — acceptable for families but not a draw, mixed tenant base, ~2y average lease.
- Zoned schools: Keystone Oaks Ms (math 30% / reading 58%, grade D, #202 of 512 statewide, top 40%, 382 students, 49% FRL); Keystone Oaks Hs (math 67% / reading 24%, grade D-, #183 of 437 statewide, top 43%, 570 students, 35% FRL).
- Watch-outs: built in 1935 — expect roof / HVAC / electrical / plumbing capex.
- Market conditions: Rents rising (+3.6%/yr); 44 active listings in the ZIP; solid renter incomes; 2,996 units permitted in Allegheny County in 2024 (1,588 in 5+ unit buildings).
- 5 sale attempts since 23y ago with the ask held roughly flat each time — persistent listings suggest the price (not the market) is what's stuck; bring a comps-based counter.
- Current owner paid $257k; 36% above their basis — modest negotiation headroom, anchor on the comps not their cost.
- Cap rate 6.4% vs local median 3.6% in Dormont — top-decile yield for the area; either an underpriced asset or a hidden risk that comps aren't pricing in. Stress-test before assuming the spread holds.
- At $3,269/mo this rent would consume 49% of the median local household income ($80k/yr) (locally 512% of renters already pay >50% of income on rent) — very limited rent-growth headroom before tenants either downsize or default.
Questions for listing agent
- Can we see the unit-by-unit rent roll, current vacancy, and any below-market leases? What's the average tenancy length?
- What capital expenditures (roof, boiler, parking lot, exteriors) have been made in the last 5 years, and what's planned in the next 2?
- Built in 1935 — when were the roof, HVAC, electrical panel, plumbing, and water heater last replaced?
- Is there a deadline driving the sale (1031 exchange, divorce, estate, relocation)? That informs how much negotiation room exists.
- Schools are A-rated — typically a magnet for longer-tenancy family renters. What's the average tenant stay here, and is there a school-zone premium baked into asking?
- The area grade is low — what's the realistic commute time and amenity access for the typical tenant pool here? Any planned neighborhood developments (good or bad) we should know about?
- What's the average days-on-market for RENTAL listings here right now (not sales)? A rising rental-DOM trend means longer vacancies and softer asking-rent achievability than the comps imply.
- What's the recent tenant-quality profile in this submarket — average credit score on applications, eviction rate, late-payment / NSF rate, and stable-employment percentage? A property-management company in the area should have these aggregated.
CashFlowRE · CFR-SXBHKRF06XHKR6
· Data 1 day ago
cashflowre.app · 2026-05-29