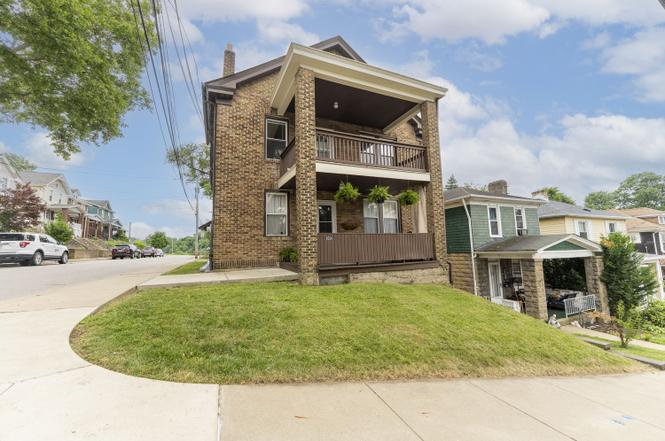
 Duplex
3031 Pinehurst Ave · Dormont, PA
Flood risk 3/10 · Minor
- FEMA flood zone
- X (unshaded)
- Chance of flooding over 30 yrs
- 0.2%
- Est. flood insurance / yr
- $473 – $860
Fire risk 1/10 · Minimal
- Est. fire insurance / yr
- $511 – $949
Heat risk 4/10 · Minor
- Hot days now (above 97°F)
- 7 days/yr
- Hot days in 30 yrs
- 17 days/yr
Wind risk 2/10 · Minimal
- Chance of severe wind over 30 yrs
- —
Air-quality risk 3/10 · Minor
- Unhealthy air days now
- 3 days/yr
- Unhealthy air days in 30 yrs
- 5 days/yr
Risk factors via First Street. Map © Google.
Why this score? — see what drove the D- grade
The composite is a weighted blend of 9 inputs, each scored 0–100. Each bar is that input's sub-score; the figure is the points it added to the 100-point composite (weight × sub-score).
- Cash flow +11.7/30.0
- Livability +4.8/5.0
- Schools +4.7/10.0
- 1% rule +3.8/10.0
- DSCR +3.5/10.0
- Rent growth +3.4/5.0
- ARV discount +3.1/15.0
- Condition / age +2.5/5.0
- Appreciation +0.0/10.0
$350,000
🖨 Deal sheet (PDF) 📄 Offer letter ✓ Due diligence
Multi-family units
County records classify this as Multi-Family (2-4 Unit). Listing-text estimate: 2 units. confirmed
Listing remarks MLS
Remarkable Duplex. Very roomy with each unit having a covered porch. Recently rehabbed. Separate Gas & Electric. Owners bill back tenants for water and sewage
Key facts
- Covered porches
- Private laundry
- Updated kitchen
Tags
Property features AI
Finance
- Financial info: Rents reported: one unit at $1,450 and the other at $1,400
Exterior
- Parking: Off-street parking for 4 vehicles
- Utilities: Electric service available; Natural gas available; Sewer available
- Home design: Multi-family property with 2 units
- Construction: Brick construction; Composition roof
- Exterior features: Lot dimensions approximately 33 x 110; Zoned R-2
Interior
- Bedrooms: Two 3-bedroom units (each unit has 3 bedrooms)
- Bathrooms: Each unit has 1 full bathroom
- Interior features: Basement present; Public transportation access nearby
Neighborhood map
What this means for you Summary
Snapshot
- This is a 2 × 3-bed/1.0-bath units multifamily listed at $350k.
Deal economics
- At list price, monthly cash flow is $-100 ($-1k/yr) — negative. Per door: $-50/mo.
- To cash-flow at today's rent, offer at most $332k (5.0% below list).
- To meet the 1% rule (rent ≥ 1% of price), the offer needs to be $309k (11.8% below list).
- Recommended offer: $309k (11.8% below list) — sets the bar for 1% rule.
- Cap rate 6.0% vs local median 3.6% in Dormont — top-decile yield for the area; either an underpriced asset or a hidden risk that comps aren't pricing in. Stress-test before assuming the spread holds.
Location & tenants
- Location reads 95/100 on livability (#1 in PA, #1 nationally) — a professional / high-income tenant draw. Strengths: crime A+, amenities A+, commute A+.
- Keystone Oaks SD (suburban): math 45% / reading 65% proficiency, ranked #116 of 539 in PA (top 22%) — acceptable for families but not a draw, mixed tenant base, ~2y average lease.
- Zoned schools: Keystone Oaks Ms (math 30% / reading 58%, grade D, #202 of 512 statewide, top 40%, 382 students, 49% FRL); Keystone Oaks Hs (math 67% / reading 24%, grade D-, #183 of 437 statewide, top 43%, 570 students, 35% FRL).
- Market conditions: Rents rising (+3.6%/yr); 44 active listings in the ZIP; solid renter incomes; 2,996 units permitted in Allegheny County in 2024 (1,588 in 5+ unit buildings).
- At $3,086/mo this rent would consume 46% of the median local household income ($80k/yr) (locally 512% of renters already pay >50% of income on rent) — very limited rent-growth headroom before tenants either downsize or default.
Forward outlook
- Local home prices are declining (-3.0%/yr); year-one equity from $2k of loan paydown is wiped out by about $10k of value loss. Plan a longer hold.
Negotiation context
- Only 4 days on market — expect competitive offers; lowballing is unlikely to land.
- 5 sale attempts since 23y ago with the ask held roughly flat each time — persistent listings suggest the price (not the market) is what's stuck; bring a comps-based counter.
- Current owner paid $257k; 36% above their basis — modest negotiation headroom, anchor on the comps not their cost.
Risks & watch-outs
- Watch-outs: built in 1935 — expect roof / HVAC / electrical / plumbing capex.
Questions for the listing agent
- What do current leases actually rent for vs. the listed asking? Can we see a recent rent roll and the last 12 months of T-12 income?
- Can we see the unit-by-unit rent roll, current vacancy, and any below-market leases? What's the average tenancy length?
- What capital expenditures (roof, boiler, parking lot, exteriors) have been made in the last 5 years, and what's planned in the next 2?
- Built in 1935 — when were the roof, HVAC, electrical panel, plumbing, and water heater last replaced?
- Is there a deadline driving the sale (1031 exchange, divorce, estate, relocation)? That informs how much negotiation room exists.
- Schools are A-rated — typically a magnet for longer-tenancy family renters. What's the average tenant stay here, and is there a school-zone premium baked into asking?
- The area grade is low — what's the realistic commute time and amenity access for the typical tenant pool here? Any planned neighborhood developments (good or bad) we should know about?
- What's the average days-on-market for RENTAL listings here right now (not sales)? A rising rental-DOM trend means longer vacancies and softer asking-rent achievability than the comps imply.
- What's the recent tenant-quality profile in this submarket — average credit score on applications, eviction rate, late-payment / NSF rate, and stable-employment percentage? A property-management company in the area should have these aggregated.
- How much new apartment / multifamily construction is in the pipeline within 1–3 miles? Heavy new supply (>2% of stock underway) typically softens rents 12–24 months out; light construction supports rent growth.
Investment metrics
- 1% rule
- 0.88% ✗
- Cap rate
- 5.95%
- Cash-on-cash
- -1.22%
- DSCR
- 0.95
- GRM
- 9.5
CMA / ARV
- ARV (on-the-fly)
- $319,000
- Comps found
- 1
Show comp detail 1 sale within ~0.75 mi
| Address | Dist | Beds/Ba | Sqft | Sold | Price | $/sf | Match |
|---|---|---|---|---|---|---|---|
| 2975 Belrose Ave | 0.41mi | 5/2.0 (-1) | 2,605 (+2%) | 20mo | $325,000 | $125 | 56 |
Match score weights: distance 35% · size 25% · config 20% · recency 20%. Top-matched comps best support the ARV.
Projected returns pro-forma
-3.0% appreciation · 3.61% rent growth · sell at horizon
- IRR
- -17.6%
- Equity multiple
- 0.38×
- Total profit
- $-61,048
- Equity at exit
- $52,186
- IRR
- -8.4%
- Equity multiple
- 0.46×
- Total profit
- $-52,944
- Equity at exit
- $30,262
Cash invested: $98,000 (down + closing). Projections, not guarantees.
Landlord ↔ Tenant lean methodology
- Overall (STATE)
- 62 Landlord-Friendly
- State Pennsylvania
- 62 Landlord-Friendly · EVEN
- County
- — inherits STATE
- City
- — inherits STATE
ZIP-level market 15216
- Rents YoY
- 3.6%
- Active inventory
- 44
- Price-to-rent
- 18.9×
Monthly cashflow live
- Estimated rent
- $3,086 high interval (Pro) →
- Mortgage (P&I)
- −$1,835
- Tax from tax record
- −$557 /mo · $6,678/yr
- Insurance
- −$146
- HOA
- −$0
- Vacancy / Maint / Mgmt
- −$648
- Net cashflow
- $-100
Break-even live
Sensitivity live
| Price | -10% $98 | -5% $-1 | +0% $-100 | +5% $-199 | +10% $-298 |
|---|---|---|---|---|---|
| Rent | -10% $-344 | -5% $-222 | +0% $-100 | +5% $22 | +10% $144 |
| Rate | -1.0pp $76 | -0.5pp $-11 | base $-100 | +0.5pp $-191 | +1.0pp $-283 |
2-unit breakdown (identical units grouped — click to expand)
| Units | Beds | Baths | Est. rent |
|---|---|---|---|
| 2× units | 3 | 1 | $3,086 |
| #1 | 3 | 1 | $1,543 |
| #2 | 3 | 1 | $1,543 |
| Total (2 units) | $3,086 | ||
UW: 25.0% down · 7.5% · 30yr · 1.5% tax · 5.0% vac · 8.0% maint · 8.0% mgmt
Financing live
Cash to close
- Down payment
- $87,500
- Closing costs
- $10,500
- Reserves months
- —
- Total cash needed
- —
Loan-product check · same deal, 3 products live
Conventional
25% down · 7.5% · 30yr
- Down + closing
- —
- Monthly P&I
- —
- Monthly cashflow
- —
- DSCR
- —
- Eligible?
- —
Personal DTI + credit; lowest rate.
DSCR
20% down · 8.5% · 30yr
- Down + closing
- —
- Monthly P&I
- —
- Monthly cashflow
- —
- DSCR
- —
- Eligible?
- —
No personal income docs; deal must DSCR.
Hard money
10% down · 12.0% · 12mo
- Down + closing
- —
- Monthly P&I
- —
- Monthly cashflow
- —
- DSCR
- —
- Eligible?
- —
Short-term bridge; refi at stabilization.
Listing history 3 events
-
2026-06-21days on market $350,000 Active 4 DOM
-
2026-06-17remarks 699-char remark
-
2026-06-17$350,000 Active 1 DOM
ⓘ Source: listings_history table (triggers on properties + properties_extension) + one-shot
backfill from property_details.listing_events for pre-trigger history.
Tax reassessment forecast PA · Partial reset (capped growth)
- Current annual tax
- $6,678 · $557/mo
- Projected year-2 tax
- $6,678 · $557/mo
- Expected delta
- $0/yr ($0/mo · -0.0%)
ⓘ Screening estimate from a state-policy table — verify with the county assessor before closing.
Climate risk First Street
- Flood 3/10 Moderate FEMA zone X (unshaded) · 20% chance over 30 yrs
- Wildfire 1/10 Low
- Heat 4/10 Moderate 7 d/yr ≥97°F today · 17 d/yr by 30 yrs out
- Wind 2/10 Low
- Air quality 3/10 Moderate 3 unhealthy d/yr today · 5 by 30 yrs out
Nearby sold comps map
Loading sold comps map…
Walkable amenities ~0.75 mi
Loading nearby amenities…
Taxation est. · year 1
- Rental income
- $37,032
- − Mortgage interest
- −$19,605
- − Property taxes
- −$6,678
- − Insurance
- −$1,750
- − Repairs & maintenance
- −$2,963
- − Management
- −$2,963
- − Depreciation
- −$10,182
- Taxable loss
- −$7,108
- Est. tax savings @ 24.0%
- +$1,706
- After-tax cash flow
- $508/yr
For passive investors: Depreciation is non-cash, so a rental often shows a tax loss while cash-flowing — sheltering income. Rental losses are passive: they offset passive income freely, and up to $25,000/yr can offset ordinary (W-2) income if you actively participate and your MAGI is under $100k (phasing out to $0 by $150k); unused losses carry forward. On sale, claimed depreciation is recaptured at up to 25%, and gains may owe capital-gains tax (a 1031 exchange can defer both). Figures are a year-1 estimate at your 24.0% rate — not tax advice; consult a CPA.
Schools (NCES district)
- District
- Keystone Oaks SD
- NCES district ID
- 4212750
- Math proficiency
- 45% ▼ -15.00%
- Reading proficiency
- 65% ▼ -8.00%
- Median HH income
- $54,066
- Composite
- 47.24/100
- National rank
- #2314
- State rank
- #116 of 539 in PA
Livability — Dormont
- Score
- 95/100
- State rank
- #1
- US rank
- #1
Category grades
Schools grade is shown separately in the Schools card above.
Census & demographics
- Census place
- Dormont, PA
- County
- Allegheny County · 1,022,028 people
- Metro
- Pittsburgh, PA
- Population (ZIP)
- 21,471
- Household income
- $80,313
- Rent vs Own
- Severe rent burden
- 512.0
Population outlook (Allegheny County) Hauer SSP2
- Today (2025)
- 1,250,282 people
- By 2030
- 1,256,482 · +0.5%
- By 2040
- 1,256,318 · +0.5%
- By 2050
- 1,244,169 · -0.5%
- By 2075
- 1,197,693 · -4.2%
- By 2100
- 1,093,187 · -12.6%
Race, ethnicity, and origin ACS 2023
- Neighborhood character
- Predominantly White (81%)
- Race & ethnicity
- White 81% Black 9% Two or more races 4% Hispanic / Latino 3% Asian 2%
- Common ancestry
- Romanian 8% Slovak 2% Serbian 2%
- Foreign-born
- 4% · Canada, China, Vietnam
- Languages at home
- 93% English-only · Spanish 3% Other Indo-European 1% Other Asian/Pacific 1%
Political lean MEDSL · Allegheny
- 2024 margin
- Strong D (+20.3) · D 59.7% · R 39.4%
- 2008→2024 swing
- +4.8pp toward D · 2008: 15.5pp · 2024: 20.3pp
- All cycles
- 2024: D+20.3 2020: D+20.4 2016: D+16.4 2012: D+14.4 2008: D+15.5
Not yet ingested
- Civics
- —
Market trends
- HPI YoY
- ▼ -154.58%
- Current HPI
- 272.8301
- Rent YoY
- ▲ 3.61%
- Metro
- Pittsburgh, PA
- State GDP YoY
- ▲ 1.68%
- F500 in state
- 34
Industry mix (Fortune 500 HQ in PA)
| Industry | F500 HQs | Revenue |
|---|---|---|
| Healthcare | 2 | $309B |
|
||
| Insurance | 2 | $27B |
|
||
| Telecommunications / Media | 1 | $124B |
|
||
| Industrial Distribution | 1 | $22B |
|
||
| Financial Services | 1 | $20B |
|
||
| Chemicals / Materials | 1 | $18B |
|
||
Price history
+775.0% since first listed10 events — show timeline
- 2026-06-15 Listed $350,000 West Penn MLS
- 2020-11-16 Sold (MLS) $257,000 West Penn MLS
- 2020-09-03 Pending — West Penn MLS
- 2020-08-31 Listed $259,900 West Penn MLS
- 2014-05-27 Listed $129,900 West Penn MLS
- 2013-09-27 Listed $129,900 West Penn MLS
- 2004-08-23 Sold (Public Records) $122,500 Public Records
- 2004-08-05 Sold (MLS) $122,500 West Penn MLS
- 2003-09-23 Listed $139,900 West Penn MLS
- 1985-05-23 Sold (Public Records) $40,000 Public Records
Property tax history
+6.7%/yrLatest (2026): $6,678 · +6.1% YoY. Source: county tax records.
Cash-flow waterfall
monthlySold comps — $/sqft
last 12 mo · ≤1 miLoading sold comps…