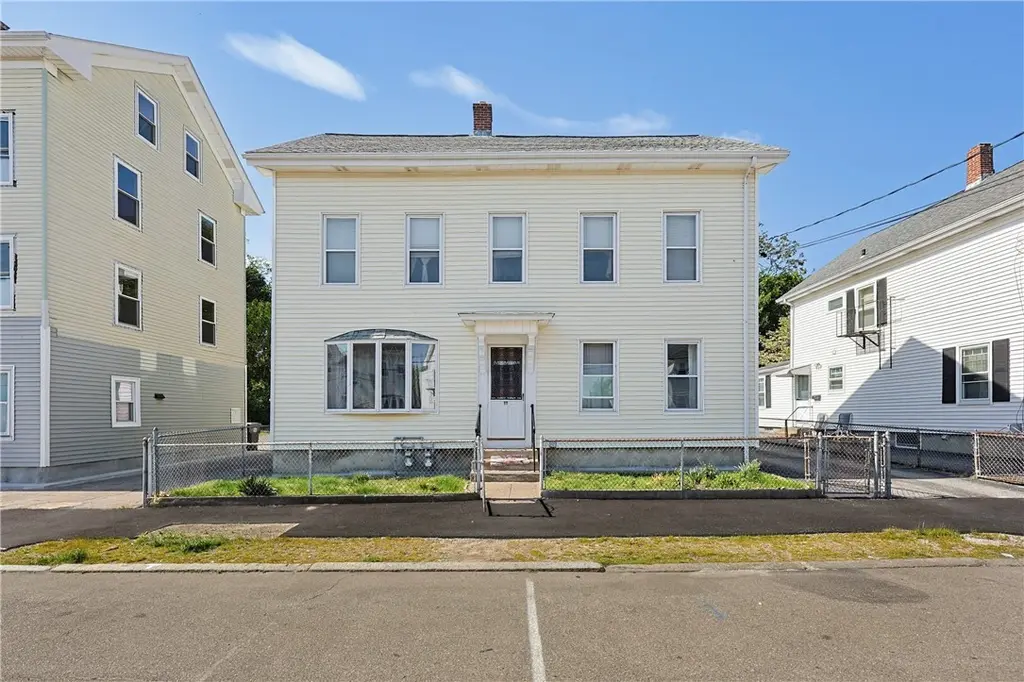
19 Elm St
Valley Falls, RI 02864
$549,900F
4 bd · 2.0 ba ·
1,946 sqft ·
Built 1900
· MultiFamily
· Pending
· 23 DOM
Cashflow @ list (25.0% down · 7.5%)
Estimated rent
$3,983/mo
Mortgage (P&I)
−$2,884
Tax + insurance
−$639
HOA
−$0
Vac / Maint / Mgmt
−$836
Net cashflow
$-376/mo
Annual
$-4,510/yr
Cap rate
5.47%
Cash-on-cash
-2.93%
DSCR
0.87
1% rule
0.72%
Cash to close
$153,972
Investor read
- This is a 2 × 2-bed/1.0-bath units multifamily listed at $550k.
- At list price, monthly cash flow is $-376 ($-5k/yr) — negative. Per door: $-188/mo.
- To cash-flow at today's rent, offer at most $484k (12.1% below list).
- To meet the 1% rule (rent ≥ 1% of price), the offer needs to be $398k (27.6% below list).
- It's been on market 23 days — a 2% lower offer ($542k) is reasonable based on typical stale-listing flexibility.
- Recommended offer: $398k (27.6% below list) — sets the bar for 1% rule.
- Local home prices are declining (-3.0%/yr); year-one equity from $4k of loan paydown is wiped out by about $16k of value loss. Plan a longer hold.
- Location reads 75/100 on livability (#8 in RI, #4,293 nationally) — a middle-class / working-renter tenant base. Strengths: crime A+, employment A+, housing A+; Watch: schools D, amenities F, commute F.
- Cumberland (suburban): math 40% / reading 52% proficiency, ranked #9 of 39 in RI (top 23%) — families likely to look elsewhere, expect single-tenant / working-renter base with shorter leases; only 18% free/reduced lunch — higher-income household profile.
- Watch-outs: built in 1900 — expect roof / HVAC / electrical / plumbing capex.
- Market conditions: Rents soft (-1.5%/yr); 141 active listings in the ZIP; 9 comparable units currently listed for rent nearby; rentals leasing fast (median 12d on market — plan ~1-2 weeks tenant-placement turnaround); high-income renter base; 776 units permitted in Providence County in 2024 (229 in 5+ unit buildings).
- Providence County population projected at +5% by 2050 — modest demand growth; plan on rents tracking national, not racing it.
- Climate carrying-cost: major flood risk; major wind risk, 70% chance of damaging wind over 30y; extreme-heat days projected 7→15/yr by 2055 (HVAC capex compounding) — expect insurance premiums to compound above CPI over the hold.
- Cap rate 5.5% vs local median 3.3% in Valley Falls — top-decile yield for the area; either an underpriced asset or a hidden risk that comps aren't pricing in. Stress-test before assuming the spread holds.
- This rent runs 41% of the median local income ($118k/yr) — at the standard rent-burdened threshold; future hikes will face affordability resistance.
Questions for listing agent
- What do current leases actually rent for vs. the listed asking? Can we see a recent rent roll and the last 12 months of T-12 income?
- Can we see the unit-by-unit rent roll, current vacancy, and any below-market leases? What's the average tenancy length?
- What capital expenditures (roof, boiler, parking lot, exteriors) have been made in the last 5 years, and what's planned in the next 2?
- Built in 1900 — when were the roof, HVAC, electrical panel, plumbing, and water heater last replaced?
- Is there a deadline driving the sale (1031 exchange, divorce, estate, relocation)? That informs how much negotiation room exists.
- Schools are D-rated, which usually means shorter tenancies and higher turnover. Who's the typical renter profile here, and what's been the actual vacancy rate?
- The area grade is low — what's the realistic commute time and amenity access for the typical tenant pool here? Any planned neighborhood developments (good or bad) we should know about?
- What's the average days-on-market for RENTAL listings here right now (not sales)? A rising rental-DOM trend means longer vacancies and softer asking-rent achievability than the comps imply.
CashFlowRE · CFR-SXJG4PF4280DFS
· Data 5 days ago
cashflowre.app · 2026-05-29