 Duplex
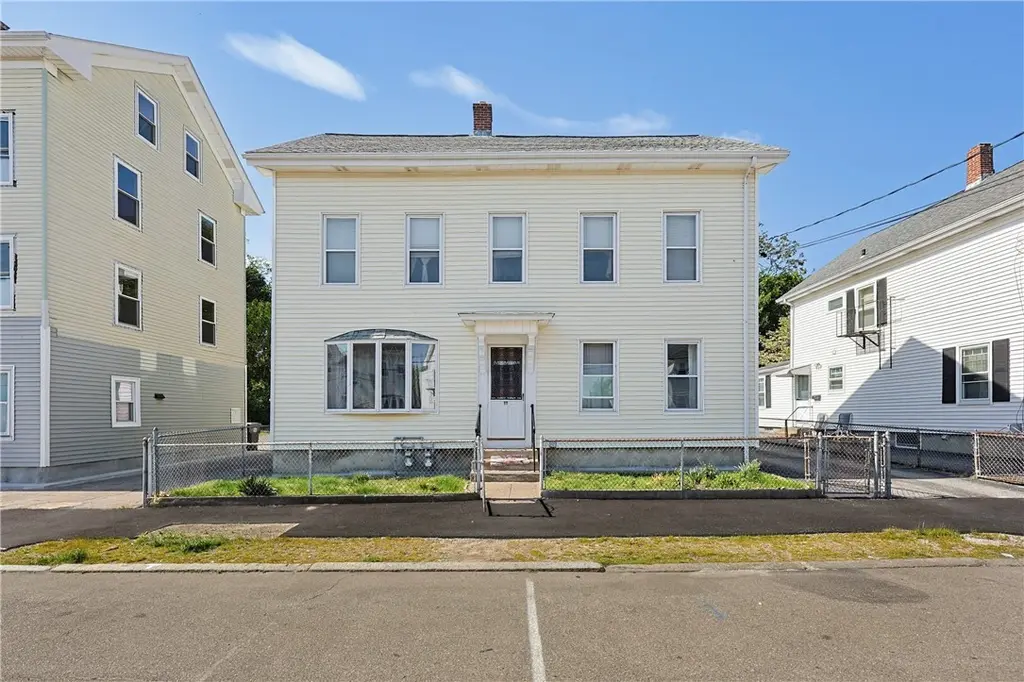
19 Elm St · Valley Falls, RI
Flood risk 6/10 · Moderate
- FEMA flood zone
- X (unshaded)
- Chance of flooding over 30 yrs
- 0.69%
- Est. flood insurance / yr
- $473 – $860
Fire risk 1/10 · Minimal
- Est. fire insurance / yr
- $835 – $1,551
Heat risk 6/10 · Moderate
- Hot days now (above 96°F)
- 7 days/yr
- Hot days in 30 yrs
- 15 days/yr
Wind risk 6/10 · Moderate
- Chance of severe wind over 30 yrs
- 70.0%
Air-quality risk 2/10 · Minimal
- Unhealthy air days now
- 1 days/yr
- Unhealthy air days in 30 yrs
- 2 days/yr
Risk factors via First Street. Map © Google.
Why this score? — see what drove the F grade
The composite is a weighted blend of 9 inputs, each scored 0–100. Each bar is that input's sub-score; the figure is the points it added to the 100-point composite (weight × sub-score).
- Cash flow +9.6/30.0
- ARV discount +4.7/15.0
- Schools +4.2/10.0
- Livability +3.8/5.0
- DSCR +2.7/10.0
- Condition / age +2.5/5.0
- 1% rule +2.2/10.0
- Rent growth +2.1/5.0
- Appreciation +0.0/10.0
$549,900
🖨 Deal sheet 📄 Offer letter ✓ Due diligence
Multi-family units
County records classify this as Multi-Family (2-4 Unit). Listing-text estimate: 2 units. confirmed
Listing remarks
Spacious and well-maintained 2-family property offering excellent owner-occupant or investment potential! The first-floor unit features 3 generous bedrooms, while the second-floor unit offers 2 bedrooms with comfortable living space. A large walk-up third floor provides tremendous opportunity for expansion convert it into an additional unit, combine it with the second floor to dramatically increase living space and rental income potential, or simply utilize it for storage. This property also features separate utilities, a low-maintenance exterior with vinyl siding and replacement windows, a 2-car garage, fenced yard, and plenty of off-street parking. A versatile multi-family property with
Key facts
- 2 family property
- Separate utilities
- Fenced yard
Tags
Property features AI
Finance
- Financial info: Tenant pays hot water
- HOA & community: Community access to highways, public transportation, sidewalks, shopping, restaurants, recreation areas, tennis courts, and nearby hospitals and schools
Exterior
- Parking: Detached garage with garage door opener; 2 covered garage spaces; 6 total parking spaces
- Utilities: Public water (connected); Public sewer (connected); Electric service with 100 amps and circuit breakers
- Home design: 3 total stories; Vinyl siding exterior; Drywall and plaster interior walls
- Construction: Concrete perimeter foundation
- Exterior features: Paved driveway; Fenced yard
Interior
- Kitchen: Oven; Range; Range hood; Refrigerator
- Flooring: Carpet; Ceramic tile; Vinyl
- Bathrooms: 2 full bathrooms
- Heating & cooling: Baseboard heating; Gas heating; Hot water heating
- Interior features: Thermal windows; Storm door(s); Attic with permanent attic stairs; Storage space; Tub/shower; Cable TV
- Laundry & utility: Common area laundry; Gas water heater; Water heater
Neighborhood map
What this means for you Summary
Snapshot
- This is a 2 × 2-bed/1.0-bath units multifamily listed at $550k.
Deal economics
- At list price, monthly cash flow is $-376 ($-5k/yr) — negative. Per door: $-188/mo.
- To cash-flow at today's rent, offer at most $484k (12.1% below list).
- To meet the 1% rule (rent ≥ 1% of price), the offer needs to be $398k (27.6% below list).
- Recommended offer: $398k (27.6% below list) — sets the bar for 1% rule.
- Cap rate 5.5% vs local median 3.3% in Valley Falls — top-decile yield for the area; either an underpriced asset or a hidden risk that comps aren't pricing in. Stress-test before assuming the spread holds.
Location & tenants
- Location reads 75/100 on livability (#8 in RI, #4,293 nationally) — a middle-class / working-renter tenant base. Strengths: crime A+, employment A+, housing A+; Watch: schools D, amenities F, commute F.
- Cumberland (suburban): math 40% / reading 52% proficiency, ranked #9 of 39 in RI (top 23%) — families likely to look elsewhere, expect single-tenant / working-renter base with shorter leases; only 18% free/reduced lunch — higher-income household profile.
- Market conditions: Rents soft (-1.5%/yr); 141 active listings in the ZIP; 9 comparable units currently listed for rent nearby; rentals leasing fast (median 12d on market — plan ~1-2 weeks tenant-placement turnaround); high-income renter base; 776 units permitted in Providence County in 2024 (229 in 5+ unit buildings).
- This rent runs 41% of the median local income ($118k/yr) — at the standard rent-burdened threshold; future hikes will face affordability resistance.
Forward outlook
- Local home prices are declining (-3.0%/yr); year-one equity from $4k of loan paydown is wiped out by about $16k of value loss. Plan a longer hold.
- Providence County population projected at +5% by 2050 — modest demand growth; plan on rents tracking national, not racing it.
Negotiation context
- It's been on market 23 days — a 2% lower offer ($542k) is reasonable based on typical stale-listing flexibility.
Risks & watch-outs
- Watch-outs: built in 1900 — expect roof / HVAC / electrical / plumbing capex.
- Climate carrying-cost: major flood risk; major wind risk, 70% chance of damaging wind over 30y; extreme-heat days projected 7→15/yr by 2055 (HVAC capex compounding) — expect insurance premiums to compound above CPI over the hold.
Questions for the listing agent
- What do current leases actually rent for vs. the listed asking? Can we see a recent rent roll and the last 12 months of T-12 income?
- Can we see the unit-by-unit rent roll, current vacancy, and any below-market leases? What's the average tenancy length?
- What capital expenditures (roof, boiler, parking lot, exteriors) have been made in the last 5 years, and what's planned in the next 2?
- Built in 1900 — when were the roof, HVAC, electrical panel, plumbing, and water heater last replaced?
- Is there a deadline driving the sale (1031 exchange, divorce, estate, relocation)? That informs how much negotiation room exists.
- Schools are D-rated, which usually means shorter tenancies and higher turnover. Who's the typical renter profile here, and what's been the actual vacancy rate?
- The area grade is low — what's the realistic commute time and amenity access for the typical tenant pool here? Any planned neighborhood developments (good or bad) we should know about?
- What's the average days-on-market for RENTAL listings here right now (not sales)? A rising rental-DOM trend means longer vacancies and softer asking-rent achievability than the comps imply.
- What's the recent tenant-quality profile in this submarket — average credit score on applications, eviction rate, late-payment / NSF rate, and stable-employment percentage? A property-management company in the area should have these aggregated.
- How much new apartment / multifamily construction is in the pipeline within 1–3 miles? Heavy new supply (>2% of stock underway) typically softens rents 12–24 months out; light construction supports rent growth.
Investment metrics
- 1% rule
- 0.72% ✗
- Cap rate
- 5.47%
- Cash-on-cash
- -2.93%
- DSCR
- 0.87
- GRM
- 11.5
CMA / ARV
- ARV (on-the-fly)
- $517,636
- Comps found
- 4
Show comp detail 4 sales within ~0.75 mi
| Address | Dist | Beds/Ba | Sqft | Sold | Price | $/sf | Match |
|---|---|---|---|---|---|---|---|
| 12 Geldard St | 0.08mi | 4/2.0 | 1,900 (-2%) | 19mo | $505,000 | $266 | 77 |
| 346 High St | 0.34mi | 5/2.0 (+1) | 1,854 (-5%) | 21mo | $490,000 | $264 | 54 |
| 415 Brown St | 0.67mi | 4/2.0 | 1,892 (-3%) | 14mo | $550,000 | $291 | 53 |
| 34 Lewis St | 0.63mi | 4/2.0 | 1,800 (-8%) | 10mo | $465,000 | $258 | 49 |
Match score weights: distance 35% · size 25% · config 20% · recency 20%. Top-matched comps best support the ARV.
Projected returns pro-forma
-3.0% appreciation · 0.0% rent growth · sell at horizon
- IRR
- -24.3%
- Equity multiple
- 0.19×
- Total profit
- $-124,830
- Equity at exit
- $81,992
- IRR
- -30.4%
- Equity multiple
- -0.20×
- Total profit
- $-185,085
- Equity at exit
- $47,545
Cash invested: $153,972 (down + closing). Projections, not guarantees.
Landlord ↔ Tenant lean methodology
- Overall (STATE)
- 31 Tenant-Leaning
- State Rhode Island
- 31 Tenant-Leaning · D+8
- County
- — inherits STATE
- City
- — inherits STATE
ZIP-level market 02864
- Rents YoY
- -1.5%
- Active inventory
- 141
- Price-to-rent
- 23.0×
Monthly cashflow live
- Estimated rent
- $3,983 high interval (Pro) →
- Mortgage (P&I)
- −$2,884
- Tax from tax record
- −$410 /mo · $4,915/yr
- Insurance
- −$229
- HOA
- −$0
- Vacancy / Maint / Mgmt
- −$836
- Net cashflow
- $-376
Break-even live
2-unit breakdown (identical units grouped — click to expand)
| Units | Beds | Baths | Est. rent |
|---|---|---|---|
| 2× units | 2 | 1 | $3,984 |
| #1 | 2 | 1 | $1,992 |
| #2 | 2 | 1 | $1,992 |
| Total (2 units) | $3,983 | ||
UW: 25.0% down · 7.5% · 30yr · 1.5% tax · 5.0% vac · 8.0% maint · 8.0% mgmt
Financing live
Cash to close
- Down payment
- $137,475
- Closing costs
- $16,497
- Reserves months
- —
- Total cash needed
- —
Loan-product check · same deal, 3 products live
Conventional
25% down · 7.5% · 30yr
- Down + closing
- —
- Monthly P&I
- —
- Monthly cashflow
- —
- DSCR
- —
- Eligible?
- —
Personal DTI + credit; lowest rate.
DSCR
20% down · 8.5% · 30yr
- Down + closing
- —
- Monthly P&I
- —
- Monthly cashflow
- —
- DSCR
- —
- Eligible?
- —
No personal income docs; deal must DSCR.
Hard money
10% down · 12.0% · 12mo
- Down + closing
- —
- Monthly P&I
- —
- Monthly cashflow
- —
- DSCR
- —
- Eligible?
- —
Short-term bridge; refi at stabilization.
Rent comps 9 comps
| Address | Beds | Baths | Sqft | Rent | $/sqft | DOM | Units | Dist |
|---|---|---|---|---|---|---|---|---|
| 14 Carpenter St Unit 1 Cumberland, RI | 4.0 | 1.0 | 1467 | $2,850 | $1.94 | 1d | 1 | 0.58mi |
| 513 Mendon Rd Unit 1 Attleboro, MA | 3.0 | 2.5 | 1780 | $3,979 | $2.24 | 14d | 1 | 0.68mi |
| 515 Mendon Rd Unit 2 Attleboro, MA | 3.0 | 2.5 | 1780 | $3,950 | $2.22 | 43d | 1 | 0.68mi |
| 14 Courtland St Unit 2 Central Falls, RI | 3.0 | 1.0 | 1240 | $1,850 | $1.49 | 10d | 1 | 0.70mi |
| 14 Courtland St Unit 3 Central Falls, RI | 4.0 | 1.0 | 1240 | $1,950 | $1.57 | 10d | 1 | 0.70mi |
| 96 Shawmut Ave Unit 98 Central Falls, RI | 4.0 | 1.5 | 1398 | $2,700 | $1.93 | 19d | 1 | 0.76mi |
| 244 Williams St Cumberland, RI | 4.0 | 2.0 | 1550 | $3,000 | $1.94 | 11d | 1 | 1.23mi |
| 171 Mendon Rd Attleboro, MA | 3.0 | 1.5 | 1585 | $3,500 | $2.21 | 14d | 1 | 1.29mi |
| 171 Mendon Rd Attleboro, MA | 3.0 | 1.5 | 1585 | $3,500 | $2.21 | 2d | 1 | 1.29mi |
Listing history 11 events
-
2026-06-15statusdays on market $549,900 Pending 23 DOM
-
2026-06-13days on market $549,900 Active 22 DOM
-
2026-06-09days on market $549,900 Active 18 DOM
-
2026-06-08days on market $549,900 Active 17 DOM
-
2026-06-07days on market $549,900 Active 16 DOM
-
2026-06-05days on market $549,900 Active 13 DOM
-
2026-06-03days on market $549,900 Active 12 DOM
-
2026-06-02days on market $549,900 Active 11 DOM
-
2026-06-01days on market $549,900 Active 10 DOM
-
2026-05-31days on market $549,900 Active 9 DOM
-
2026-05-22$549,900 Active
ⓘ Source: listings_history table (triggers on properties + properties_extension) + one-shot
backfill from property_details.listing_events for pre-trigger history.
Tax reassessment forecast RI · Partial reset (capped growth)
- Current annual tax
- $4,915 · $410/mo
- Projected year-2 tax
- $6,939 · $578/mo
- Expected delta
- +$2,024/yr (+$169/mo · 41.2%)
ⓘ Screening estimate from a state-policy table — verify with the county assessor before closing.
Climate risk First Street
- Flood 6/10 Major FEMA zone X (unshaded) · 69% chance over 30 yrs
- Wildfire 1/10 Low
- Heat 6/10 Major 7 d/yr ≥96°F today · 15 d/yr by 30 yrs out
- Wind 6/10 Major 70% chance of damaging wind over 30 yrs
- Air quality 2/10 Low 1 unhealthy d/yr today · 2 by 30 yrs out
Nearby sold comps map
Loading sold comps map…
Walkable amenities ~0.75 mi
Loading nearby amenities…
Taxation est. · year 1
- Rental income
- $47,796
- − Mortgage interest
- −$30,803
- − Property taxes
- −$4,915
- − Insurance
- −$2,750
- − Repairs & maintenance
- −$3,824
- − Management
- −$3,824
- − Depreciation
- −$15,997
- Taxable loss
- −$14,316
- Est. tax savings @ 24.0%
- +$3,436
- After-tax cash flow
- $-1,075/yr
For passive investors: Depreciation is non-cash, so a rental often shows a tax loss while cash-flowing — sheltering income. Rental losses are passive: they offset passive income freely, and up to $25,000/yr can offset ordinary (W-2) income if you actively participate and your MAGI is under $100k (phasing out to $0 by $150k); unused losses carry forward. On sale, claimed depreciation is recaptured at up to 25%, and gains may owe capital-gains tax (a 1031 exchange can defer both). Figures are a year-1 estimate at your 24.0% rate — not tax advice; consult a CPA.
Schools (NCES district)
- District
- Cumberland
- NCES district ID
- 4400270
- Math proficiency
- 40% ▼ -13.00%
- Reading proficiency
- 52% ▼ -10.00%
- Median HH income
- $75,407
- Composite
- 41.85/100
- National rank
- #3382
- State rank
- #9 of 39 in RI
Livability — Valley Falls
- Score
- 75/100
- State rank
- #8
- US rank
- #4293
Category grades
Schools grade is shown separately in the Schools card above.
Census & demographics
- Census place
- Valley Falls, RI
- County
- Providence County · 548,917 people
- Metro
- Providence-Warwick, RI-MA
- Population (ZIP)
- 36,820
- Household income
- $117,522
- Rent vs Own
- Severe rent burden
- 771.0
Population outlook (Providence County) Hauer SSP2
- Today (2025)
- 653,469 people
- By 2030
- 660,819 · +1.1%
- By 2040
- 672,747 · +3.0%
- By 2050
- 683,741 · +4.6%
- By 2075
- 720,435 · +10.2%
- By 2100
- 741,582 · +13.5%
Race, ethnicity, and origin ACS 2023
- Neighborhood character
- Predominantly White (83%)
- Race & ethnicity
- White 83% Hispanic / Latino 6% Two or more races 5% Asian 4% Black 3%
- Hispanic origin (detail)
- Puerto Rican 2%
- Common ancestry
- Lithuanian 11% Russian 10% Romanian 6%
- Foreign-born
- 11% · Canada, Jamaica, China
- Languages at home
- 83% English-only · Other Indo-European 7% Spanish 4% French/Haitian/Cajun 2%
Political lean MEDSL · Providence
- 2024 margin
- D (+14.4) · D 56.1% · R 41.7% · Other 2.2%
- 2008→2024 swing
- -20.0pp toward R · 2008: 34.4pp · 2024: 14.4pp
- All cycles
- 2024: D+14.4 2020: D+22.9 2016: D+21.2 2012: D+34.9 2008: D+34.4
Not yet ingested
- Civics
- —
Market trends
- HPI YoY
- ▼ -461.15%
- Current HPI
- 313.0341
- Rent YoY
- ▼ -1.48%
- Metro
- Providence-Warwick, RI-MA
- State GDP YoY
- ▲ 2.25%
- F500 in state
- 10
Industry mix (Fortune 500 HQ in RI)
| Industry | F500 HQs | Revenue |
|---|---|---|
| Healthcare | 1 | $373B |
|
||
| Food Distribution | 1 | $31B |
|
||
| Aerospace / Defense | 1 | $14B |
|
||
| Financial Services | 1 | $8B |
|
||
| Consumer Goods | 1 | $4B |
|
||
Price history
1 event — show timeline
- 2026-05-22 Listed $549,900 RIS
Property tax history
+4.7%/yrLatest (2025): $4,915 · +2.7% YoY. Source: county tax records.
Cash-flow waterfall
monthlySold comps — $/sqft
last 12 mo · ≤1 miLoading sold comps…