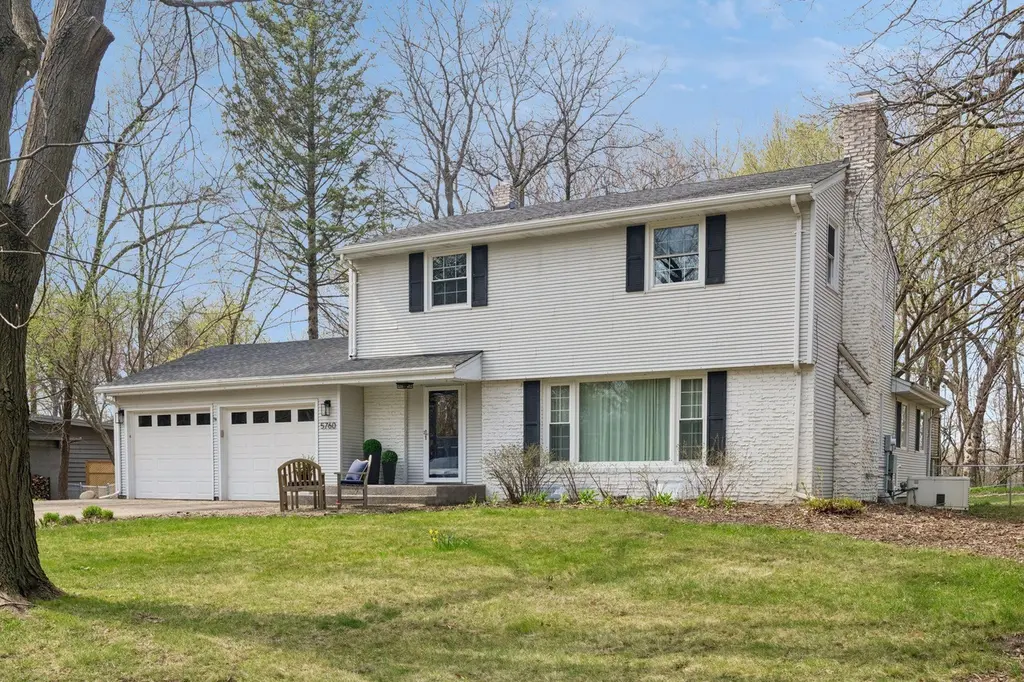
5760 Echo Rd
Shorewood, MN 55331
$650,000D
3 bd · 2.5 ba ·
2,556 sqft ·
Built 1964
· SingleFamily
· Pending
· 8 DOM
Cashflow @ list (25.0% down · 7.5%)
Estimated rent
$4,253/mo
Mortgage (P&I)
−$3,409
Tax + insurance
−$768
HOA
−$0
Vac / Maint / Mgmt
−$893
Net cashflow
$-817/mo
Annual
$-9,801/yr
Cap rate
4.79%
Cash-on-cash
-5.39%
DSCR
0.76
1% rule
0.65%
Cash to close
$182,000
Investor read
- This is a 3-bed/2.5-bath single-family listed at $650k.
- At list price, monthly cash flow is $-817 ($-10k/yr) — negative.
- To cash-flow at today's rent, offer at most $506k (22.2% below list).
- To meet the 1% rule (rent ≥ 1% of price), the offer needs to be $425k (34.6% below list).
- Only 8 days on market — expect competitive offers; lowballing is unlikely to land.
- Recommended offer: $425k (34.6% below list) — sets the bar for 1% rule.
- Local home prices are declining (-3.0%/yr); year-one equity from $4k of loan paydown is wiped out by about $20k of value loss. Plan a longer hold.
- Location reads 67/100 on livability (#464 in MN) — a middle-class / working-renter tenant base. Strengths: crime A+, employment A+, housing A+; Watch: amenities F, commute F, cost of living F.
- Minnetonka Public School District (suburban): math 68% / reading 74% proficiency, ranked #6 of 301 in MN (top 2%) — strong family-tenant draw, lease renewals of 3-5y typical; only 5% free/reduced lunch — higher-income household profile.
- Zoned schools: Minnewashta Elementary (math 69% / reading 71%, grade A-, #71 of 857 statewide, top 8%, 904 students, 5% FRL); Minnetonka West Middle (math 59% / reading 75%, grade A-, #11 of 258 statewide, top 5%, 1,274 students, 9% FRL); Minnetonka Senior High (math 68% / reading 80%, grade B+, #10 of 471 statewide, top 2%, 3,508 students, 11% FRL) — zoned schools at 9% FRL track the district average.
- Market conditions: Rents rising fast (+11.1%/yr); 244 active listings in the ZIP; 3 comparable units currently listed for rent nearby; rentals leasing fast (median 12d on market — plan ~1-2 weeks tenant-placement turnaround); high-income renter base; 4,651 units permitted in Hennepin County in 2024 (2,443 in 5+ unit buildings).
- Hennepin County population projected at +30% by 2050 — long-run rental-demand tailwind backs the buy-and-hold thesis.
- 5 sale attempts since 21y ago with the ask held roughly flat each time — persistent listings suggest the price (not the market) is what's stuck; bring a comps-based counter.
- Cap rate 4.8% vs local median 0.8% in Shorewood — top-decile yield for the area; either an underpriced asset or a hidden risk that comps aren't pricing in. Stress-test before assuming the spread holds.
- This rent runs 32% of the median local income ($159k/yr) — at the standard rent-burdened threshold; future hikes will face affordability resistance.
Questions for listing agent
- What do current leases actually rent for vs. the listed asking? Can we see a recent rent roll and the last 12 months of T-12 income?
- Built in 1964 — when were the roof, HVAC, electrical panel, plumbing, and water heater last replaced?
- Is there a deadline driving the sale (1031 exchange, divorce, estate, relocation)? That informs how much negotiation room exists.
- The area grade is low — what's the realistic commute time and amenity access for the typical tenant pool here? Any planned neighborhood developments (good or bad) we should know about?
- This sits on a lake — are riparian / water-frontage rights deeded with the parcel? Any dock permits, shoreline easements, or HOA water-use restrictions?
- What's the documented flood / surge / shoreline-erosion history here (FEMA AND non-FEMA — e.g., storm surge, creek backup, septic-field saturation)?
- Any water-quality or seasonal algae-bloom issues that affect tenant satisfaction or short-term-rental demand?
- What's the average days-on-market for RENTAL listings here right now (not sales)? A rising rental-DOM trend means longer vacancies and softer asking-rent achievability than the comps imply.
CashFlowRE · CFR-SYTPNR571CYENM
· Data 2 weeks ago
cashflowre.app · 2026-05-29