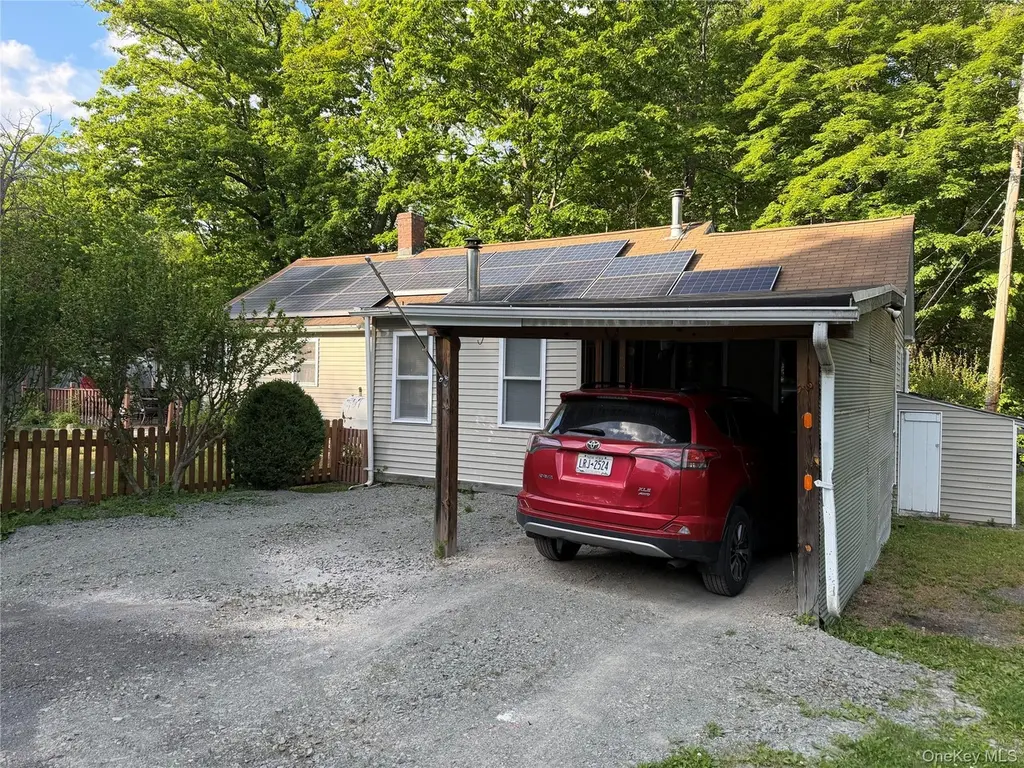
18 Maple Dr
Bloomingburg, NY 12721
$149,900B
4 bd · 2.0 ba ·
1,348 sqft ·
Built 1930
· SingleFamily
· Active
· 12 DOM
Cashflow @ list (25.0% down · 7.5%)
Estimated rent
$2,700/mo
Mortgage (P&I)
−$786
Tax + insurance
−$398
HOA
−$0
Vac / Maint / Mgmt
−$567
Net cashflow
$949/mo
Annual
$11,384/yr
Cap rate
13.89%
Cash-on-cash
27.12%
DSCR
2.21
1% rule
1.80%
Cash to close
$41,972
Investor read
- This is a 4-bed/2.0-bath single-family listed at $150k.
- At list price, monthly cash flow is $949 ($11k/yr) — positive.
- The deal already cash-flows at list — no discount required.
- Meets the 1% rule at list price ($3k rent vs $150k).
- Only 12 days on market — expect competitive offers; lowballing is unlikely to land.
- Local home prices are declining (-3.0%/yr); year-one equity from $1k of loan paydown is wiped out by about $4k of value loss. Plan a longer hold.
- Location reads 49/100 on livability (#1,175 in NY) — a working-class tenant base; expect higher turnover. Watch: cost of living D+, housing D+, crime F.
- Pine Bush Central School District (rural): math 38% / reading 45% proficiency, ranked #468 of 590 in NY (top 79%) — families likely to look elsewhere, expect single-tenant / working-renter base with shorter leases.
- Zoned schools: Pine Bush Elementary School (math 12% / reading 45%, grade F, #1,771 of 2,108 statewide, top 84%, 649 students, 53% FRL); Crispell Middle School (math 17% / reading 46%, grade F, #522 of 729 statewide, top 73%, 633 students, 52% FRL); Pine Bush Senior High School (math 92% / reading 67%, grade A-, #518 of 1,100 statewide, top 51%, 1,615 students, 56% FRL) — zoned schools average 54% FRL vs 29% district-wide (25 pts higher); higher-poverty schools than district average — tighter screening recommended.
- Watch-outs: property tax is 2.7% of price; built in 1930 — expect roof / HVAC / electrical / plumbing capex.
- Market conditions: 83 active listings in the ZIP; 1 comparable units currently listed for rent nearby; 739 units permitted in Sullivan County in 2024 (5 in 5+ unit buildings).
- Sullivan County population projected at -24% by 2050 — secular population decline; favor cash flow + early exit over multi-decade hold.
- At projected returns (-3.0% appreciation + 3.0% rent growth), your $42k cash investment doubles in ~5 years — after that, you're playing with house money.
- Cap rate 13.9% vs local median 3.6% in Bloomingburg — top-decile yield for the area; either an underpriced asset or a hidden risk that comps aren't pricing in. Stress-test before assuming the spread holds.
Questions for listing agent
- Built in 1930 — when were the roof, HVAC, electrical panel, plumbing, and water heater last replaced?
- Property tax is high relative to price — has the assessment been appealed recently, and will the sale trigger a re-assessment?
- Is there a deadline driving the sale (1031 exchange, divorce, estate, relocation)? That informs how much negotiation room exists.
- Schools are F-rated, which usually means shorter tenancies and higher turnover. Who's the typical renter profile here, and what's been the actual vacancy rate?
- Crime grade is F in this area — have there been break-ins, vandalism, or insurance claims at this property in the last 3 years? What carrier currently insures it and at what premium?
- What's the average days-on-market for RENTAL listings here right now (not sales)? A rising rental-DOM trend means longer vacancies and softer asking-rent achievability than the comps imply.
- What's the recent tenant-quality profile in this submarket — average credit score on applications, eviction rate, late-payment / NSF rate, and stable-employment percentage? A property-management company in the area should have these aggregated.
- How much new for-sale + rental construction is in the pipeline within 1–3 miles? Heavy new supply typically softens prices + rents 12–24 months out; constrained supply supports both.
CashFlowRE · CFR-T07Q4E5KESK1XP
· Data 4 days ago
cashflowre.app · 2026-05-29