18 Maple Dr · Bloomingburg, NY
Flood risk 1/10 · Minimal
- FEMA flood zone
- X (unshaded)
- Chance of flooding over 30 yrs
- 0.0%
- Est. flood insurance / yr
- $507 – $1,088
Fire risk 2/10 · Minimal
- Est. fire insurance / yr
- $691 – $1,283
Heat risk 4/10 · Minor
- Hot days now (above 99°F)
- 8 days/yr
- Hot days in 30 yrs
- 17 days/yr
Wind risk 4/10 · Minor
- Chance of severe wind over 30 yrs
- 9.0%
Air-quality risk 2/10 · Minimal
- Unhealthy air days now
- 1 days/yr
- Unhealthy air days in 30 yrs
- 2 days/yr
Risk factors via First Street. Map © Google.
Why this score? — see what drove the B grade
The composite is a weighted blend of 9 inputs, each scored 0–100. Each bar is that input's sub-score; the figure is the points it added to the 100-point composite (weight × sub-score).
- Cash flow +30.0/30.0
- 1% rule +10.0/10.0
- DSCR +10.0/10.0
- ARV discount +7.5/15.0
- Schools +3.8/10.0
- Rent growth +2.5/5.0
- Livability +2.5/5.0
- Condition / age +2.5/5.0
- Appreciation +1.6/10.0
$149,900
🖨 Deal sheet (PDF) 📄 Offer letter ✓ Due diligence
Listing remarks
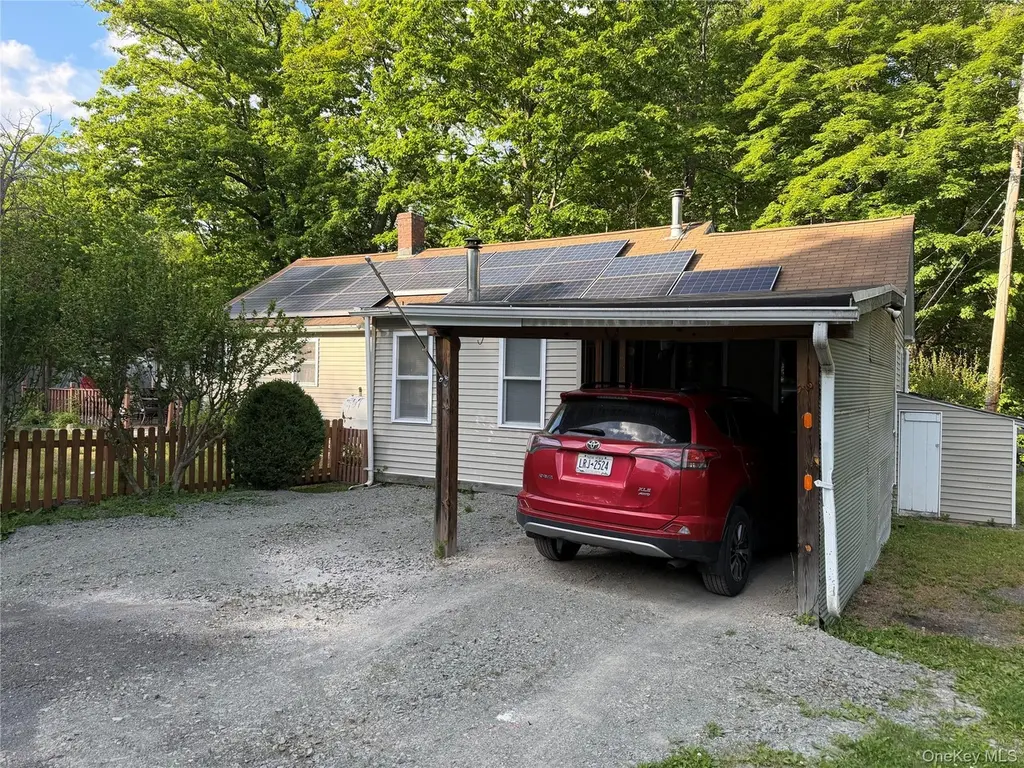
Affordable living in Orange County. This 2 bedroom spacious home was once 3 bedrooms which you can easily convert back. Nice size rooms. Walk in closet in main bedroom. Eat in kitchen. Large living room, ceiling fans all on one level living. Covered porch to enjoy your morning coffee. 2 car detached garage. Flat yard with a river view. Solar panels on roof to help offset your electric costs. Close to highway. Pine Bush Schools and low taxes.
Key facts
- Covered porch
- River view
- Eat in kitchen
Tags
Property features AI
Exterior
- Parking: 2-car garage; 1-car carport; Driveway
- Utilities: Electric service by Orange & Rockland; Septic tank; Cable connected; Electricity available
- Home design: Single family residence
- Construction: Frame construction
- Exterior features: Corner lot with front yard; Irregular, level lot with views; Waterfront
Interior
- Kitchen: Dishwasher; Electric oven; Microwave; Refrigerator
- Bedrooms: 5 total rooms (includes bedrooms and living areas)
- Bathrooms: 1 full bathroom
- Heating & cooling: Baseboard heating; Wall/window air conditioning units
- Interior features: First-floor bedroom; Ceiling fan(s); Eat-in kitchen; Storage; Scuttle attic; Crawl space basement
Neighborhood map
What this means for you Summary
Snapshot
- This is a 4-bed/2.0-bath single-family listed at $150k.
Deal economics
- At list price, monthly cash flow is $949 ($11k/yr) — positive.
- The deal already cash-flows at list — no discount required.
- Meets the 1% rule at list price ($3k rent vs $150k).
- Cap rate 13.9% vs local median 3.6% in Bloomingburg — top-decile yield for the area; either an underpriced asset or a hidden risk that comps aren't pricing in. Stress-test before assuming the spread holds.
Location & tenants
- Location reads 49/100 on livability (#1,175 in NY) — a working-class tenant base; expect higher turnover. Watch: cost of living D+, housing D+, crime F.
- Pine Bush Central School District (rural): math 38% / reading 45% proficiency, ranked #468 of 590 in NY (top 79%) — families likely to look elsewhere, expect single-tenant / working-renter base with shorter leases.
- Zoned schools: Pine Bush Elementary School (math 12% / reading 45%, grade F, #1,771 of 2,108 statewide, top 84%, 649 students, 53% FRL); Crispell Middle School (math 17% / reading 46%, grade F, #522 of 729 statewide, top 73%, 633 students, 52% FRL); Pine Bush Senior High School (math 92% / reading 67%, grade A-, #518 of 1,100 statewide, top 51%, 1,615 students, 56% FRL) — zoned schools average 54% FRL vs 29% district-wide (25 pts higher); higher-poverty schools than district average — tighter screening recommended.
- Market conditions: 83 active listings in the ZIP; 1 comparable units currently listed for rent nearby; 739 units permitted in Sullivan County in 2024 (5 in 5+ unit buildings).
Forward outlook
- Local home prices are declining (-3.0%/yr); year-one equity from $1k of loan paydown is wiped out by about $4k of value loss. Plan a longer hold.
- Sullivan County population projected at -24% by 2050 — secular population decline; favor cash flow + early exit over multi-decade hold.
- At projected returns (-3.0% appreciation + 3.0% rent growth), your $42k cash investment doubles in ~5 years — after that, you're playing with house money.
Negotiation context
- Only 12 days on market — expect competitive offers; lowballing is unlikely to land.
Risks & watch-outs
- Watch-outs: property tax is 2.7% of price; built in 1930 — expect roof / HVAC / electrical / plumbing capex.
Questions for the listing agent
- Built in 1930 — when were the roof, HVAC, electrical panel, plumbing, and water heater last replaced?
- Property tax is high relative to price — has the assessment been appealed recently, and will the sale trigger a re-assessment?
- Is there a deadline driving the sale (1031 exchange, divorce, estate, relocation)? That informs how much negotiation room exists.
- Schools are F-rated, which usually means shorter tenancies and higher turnover. Who's the typical renter profile here, and what's been the actual vacancy rate?
- Crime grade is F in this area — have there been break-ins, vandalism, or insurance claims at this property in the last 3 years? What carrier currently insures it and at what premium?
- What's the average days-on-market for RENTAL listings here right now (not sales)? A rising rental-DOM trend means longer vacancies and softer asking-rent achievability than the comps imply.
- What's the recent tenant-quality profile in this submarket — average credit score on applications, eviction rate, late-payment / NSF rate, and stable-employment percentage? A property-management company in the area should have these aggregated.
- How much new for-sale + rental construction is in the pipeline within 1–3 miles? Heavy new supply typically softens prices + rents 12–24 months out; constrained supply supports both.
Investment metrics
- 1% rule
- 1.80% ✓
- Cap rate
- 13.89%
- Cash-on-cash
- 27.12%
- DSCR
- 2.21
- GRM
- 4.6
CMA / ARV
No comps found within radius.
Projected returns pro-forma
-3.0% appreciation · 3.0% rent growth · sell at horizon
- IRR
- 21.1%
- Equity multiple
- 1.86×
- Total profit
- $36,262
- Equity at exit
- $22,351
- IRR
- 29.3%
- Equity multiple
- 3.62×
- Total profit
- $109,912
- Equity at exit
- $12,961
Cash invested: $41,972 (down + closing). Projections, not guarantees.
Landlord ↔ Tenant lean methodology
- Overall (STATE)
- 15 Strongly Tenant-Friendly
- State New York
- 15 Strongly Tenant-Friendly · D+10
- County
- — inherits STATE
- City
- — inherits STATE
ZIP-level market 12721
- Home prices YoY
- -2.1%
- Active inventory
- 83
- Price-to-rent
- 4.6×
Monthly cashflow live
- Estimated rent
- $2,700 medium interval (Pro) →
- Mortgage (P&I)
- −$786
- Tax from tax record
- −$336 /mo · $4,030/yr
- Insurance
- −$62
- HOA
- −$0
- Vacancy / Maint / Mgmt
- −$567
- Net cashflow
- $949
Break-even live
Sensitivity live
| Price | -10% $1,034 | -5% $991 | +0% $949 | +5% $906 | +10% $864 |
|---|---|---|---|---|---|
| Rent | -10% $735 | -5% $842 | +0% $949 | +5% $1,055 | +10% $1,162 |
| Rate | -1.0pp $1,024 | -0.5pp $987 | base $949 | +0.5pp $910 | +1.0pp $870 |
UW: 25.0% down · 7.5% · 30yr · 1.5% tax · 5.0% vac · 8.0% maint · 8.0% mgmt
Financing live
Cash to close
- Down payment
- $37,475
- Closing costs
- $4,497
- Reserves months
- —
- Total cash needed
- —
Loan-product check · same deal, 3 products live
Conventional
25% down · 7.5% · 30yr
- Down + closing
- —
- Monthly P&I
- —
- Monthly cashflow
- —
- DSCR
- —
- Eligible?
- —
Personal DTI + credit; lowest rate.
DSCR
20% down · 8.5% · 30yr
- Down + closing
- —
- Monthly P&I
- —
- Monthly cashflow
- —
- DSCR
- —
- Eligible?
- —
No personal income docs; deal must DSCR.
Hard money
10% down · 12.0% · 12mo
- Down + closing
- —
- Monthly P&I
- —
- Monthly cashflow
- —
- DSCR
- —
- Eligible?
- —
Short-term bridge; refi at stabilization.
Rent comps 1 comps
| Address | Beds | Baths | Sqft | Rent | $/sqft | DOM | Units | Dist |
|---|---|---|---|---|---|---|---|---|
| 90 North Rd Bloomingburg, NY | 3.0 | 1.0 | 1400 | $2,700 | $1.93 | 19d | 1 | 0.85mi |
Listing history 9 events
-
2026-06-17days on market $149,900 Active 12 DOM
-
2026-06-16days on market $149,900 Active 11 DOM
-
2026-06-15days on market $149,900 Active 10 DOM
-
2026-06-14days on market $149,900 Active 8 DOM
-
2026-06-10days on market $149,900 Active 5 DOM
-
2026-06-09days on market $149,900 Active 4 DOM
-
2026-06-08days on market $149,900 Active 3 DOM
-
2026-06-07remarks 445-char remark
-
2026-06-07$149,900 Active 2 DOM
ⓘ Source: listings_history table (triggers on properties + properties_extension) + one-shot
backfill from property_details.listing_events for pre-trigger history.
Tax reassessment forecast NY · Partial reset (capped growth)
- Current annual tax
- $4,030 · $336/mo
- Projected year-2 tax
- $4,030 · $336/mo
- Expected delta
- $0/yr ($0/mo · 0.0%)
ⓘ Screening estimate from a state-policy table — verify with the county assessor before closing.
Climate risk First Street
- Flood 1/10 Low FEMA zone X (unshaded) · 0% chance over 30 yrs
- Wildfire 2/10 Low
- Heat 4/10 Moderate 8 d/yr ≥99°F today · 17 d/yr by 30 yrs out
- Wind 4/10 Moderate 9% chance of damaging wind over 30 yrs
- Air quality 2/10 Low 1 unhealthy d/yr today · 2 by 30 yrs out
Nearby sold comps map
Loading sold comps map…
Walkable amenities ~0.75 mi
Loading nearby amenities…
Taxation est. · year 1
- Rental income
- $32,400
- − Mortgage interest
- −$8,397
- − Property taxes
- −$4,030
- − Insurance
- −$750
- − Repairs & maintenance
- −$2,592
- − Management
- −$2,592
- − Depreciation
- −$4,361
- Taxable income
- $9,679
- Est. tax owed @ 24.0%
- −$2,323
- After-tax cash flow
- $9,061/yr
For passive investors: Depreciation is non-cash, so a rental often shows a tax loss while cash-flowing — sheltering income. Rental losses are passive: they offset passive income freely, and up to $25,000/yr can offset ordinary (W-2) income if you actively participate and your MAGI is under $100k (phasing out to $0 by $150k); unused losses carry forward. On sale, claimed depreciation is recaptured at up to 25%, and gains may owe capital-gains tax (a 1031 exchange can defer both). Figures are a year-1 estimate at your 24.0% rate — not tax advice; consult a CPA.
Schools (NCES district)
- District
- Pine Bush Central School District
- NCES district ID
- 3623010
- Math proficiency
- 38% ▼ -16.00%
- Reading proficiency
- 45% ▼ -7.00%
- Median HH income
- $72,525
- Composite
- 37.87/100
- National rank
- #4324
- State rank
- #468 of 590 in NY
Livability — Bloomingburg
- Score
- 49/100
- State rank
- #1175
- US rank
- #25817
Category grades
Schools grade is shown separately in the Schools card above.
Census & demographics
- Census place
- Bloomingburg, NY
- Population (ZIP)
- 7,590
Population outlook (Sullivan County) Hauer SSP2
- Today (2025)
- 68,974 people
- By 2030
- 65,609 · -4.9%
- By 2040
- 58,878 · -14.6%
- By 2050
- 52,500 · -23.9%
- By 2075
- 39,941 · -42.1%
- By 2100
- 28,880 · -58.1%
Race, ethnicity, and origin ACS 2023
- Neighborhood character
- Predominantly White (76%)
- Race & ethnicity
- White 76% Two or more races 14% Hispanic / Latino 13% Black 3% Asian 1%
- Hispanic origin (detail)
- Puerto Rican 8% Cuban 2% Dominican 2%
- Common ancestry
- Romanian 4% Scandinavian 4% Iranian 3%
- Foreign-born
- 4% · Canada
- Languages at home
- 79% English-only · German/W. Germanic 12% Spanish 5% Other Indo-European 1%
Political lean MEDSL · Sullivan
- 2024 margin
- R (+16.7) · D 41.6% · R 58.4%
- 2008→2024 swing
- -26.2pp toward R · 2008: 9.5pp · 2024: -16.7pp
- All cycles
- 2024: R+16.7 2020: R+9.2 2016: R+13.7 2012: D+10.4 2008: D+9.5
Not yet ingested
- Civics
- —
Market trends
- HPI YoY
- ▼ -6.80%
- Current HPI
- 320.383
- Rent YoY
- —
- Metro
- —
- State GDP YoY
- ▲ 2.60%
- F500 in state
- 92
Industry mix (Fortune 500 HQ in NY)
| Industry | F500 HQs | Revenue |
|---|---|---|
| Financial Services | 10 | $950B |
|
||
| Consumer Goods | 9 | $162B |
|
||
| Insurance | 4 | $225B |
|
||
| Telecommunications | 2 | $144B |
|
||
| Pharmaceuticals | 2 | $112B |
|
||
| Media / Entertainment | 2 | $69B |
|
||
Price history
-34.8% since first listed2 events — show timeline
- 2026-06-05 Listed $149,900 OneKey® MLS as Distributed by MLS Grid
- 1998-06-01 Sold (Public Records) $230,000 Public Records
Property tax history
+7.8%/yrLatest (2025): $4,030 · -0.3% YoY. Source: county tax records.
Cash-flow waterfall
monthlySold comps — $/sqft
last 12 mo · ≤1 miLoading sold comps…