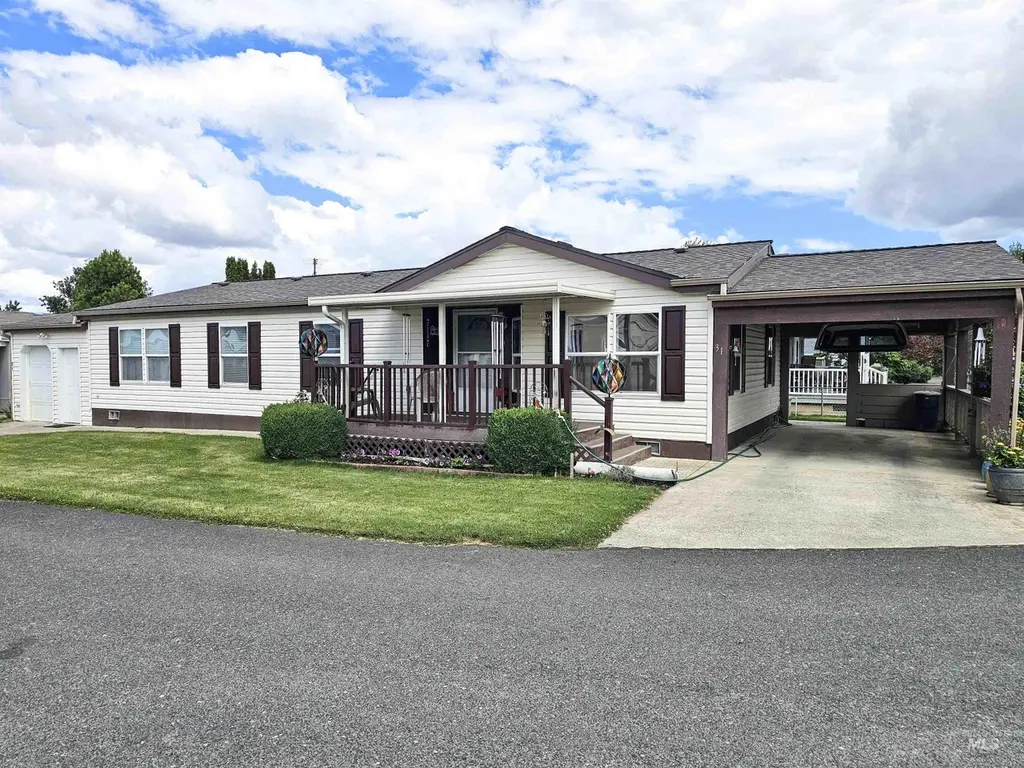
2034 Powers Ave #31
Lewiston, ID 83501
$175,000D-
3 bd · 2.0 ba ·
1,728 sqft ·
Built 2001
· Manufactured
· Active
· 8 DOM
Cashflow @ list (25.0% down · 7.5%)
Estimated rent
$1,334/mo
Mortgage (P&I)
−$918
Tax + insurance
−$149
HOA
−$0
Vac / Maint / Mgmt
−$280
Net cashflow
$-13/mo
Annual
$-151/yr
Cap rate
6.21%
Cash-on-cash
-0.31%
DSCR
0.99
1% rule
0.76%
Cash to close
$49,000
Investor read
- This is a 3-bed/2.0-bath manufactured listed at $175k.
- At list price, monthly cash flow is $-13 ($-151/yr) — negative.
- To cash-flow at today's rent, offer at most $173k (1.3% below list).
- To meet the 1% rule (rent ≥ 1% of price), the offer needs to be $133k (23.8% below list).
- Only 8 days on market — expect competitive offers; lowballing is unlikely to land.
- Recommended offer: $133k (23.8% below list) — sets the bar for 1% rule.
- Local home prices are declining (-3.0%/yr); year-one equity from $1k of loan paydown is wiped out by about $5k of value loss. Plan a longer hold.
- Location reads 75/100 on livability (#30 in ID, #4,281 nationally) — a middle-class / working-renter tenant base. Strengths: housing A+, health & safety A+, cost of living A; Watch: amenities F, commute F.
- Lewiston Independent District (urban): math 44% / reading 54% proficiency, ranked #37 of 92 in ID (top 40%) — families likely to look elsewhere, expect single-tenant / working-renter base with shorter leases.
- Zoned schools: Camelot Elementary School (math 57% / reading 52%, grade C, #106 of 357 statewide, top 33%, 352 students, 11% FRL); Lewiston High School (math 37% / reading 63%, grade D+, #39 of 169 statewide, top 23%, 1,373 students, 17% FRL) — zoned schools average 14% FRL vs 29% district-wide (15 pts lower); this property's tenant base skews higher-income than the district average.
- Market conditions: 272 active listings in the ZIP; 125 units permitted in Nez Perce County in 2024 (0 in 5+ unit buildings).
- Nez Perce County population projected at +12% by 2050 — modest demand growth; plan on rents tracking national, not racing it.
- 2 sale attempts since 11y ago with the ask held roughly flat each time — persistent listings suggest the price (not the market) is what's stuck; bring a comps-based counter.
- Cap rate 6.2% vs local median 1.9% in Lewiston — top-decile yield for the area; either an underpriced asset or a hidden risk that comps aren't pricing in. Stress-test before assuming the spread holds.
Questions for listing agent
- What do current leases actually rent for vs. the listed asking? Can we see a recent rent roll and the last 12 months of T-12 income?
- Is there a deadline driving the sale (1031 exchange, divorce, estate, relocation)? That informs how much negotiation room exists.
- The area grade is low — what's the realistic commute time and amenity access for the typical tenant pool here? Any planned neighborhood developments (good or bad) we should know about?
- What's the average days-on-market for RENTAL listings here right now (not sales)? A rising rental-DOM trend means longer vacancies and softer asking-rent achievability than the comps imply.
- What's the recent tenant-quality profile in this submarket — average credit score on applications, eviction rate, late-payment / NSF rate, and stable-employment percentage? A property-management company in the area should have these aggregated.
- How much new for-sale + rental construction is in the pipeline within 1–3 miles? Heavy new supply typically softens prices + rents 12–24 months out; constrained supply supports both.
CashFlowRE · CFR-T28Y7SAXDEFFX1
· Data 1 day ago
cashflowre.app · 2026-05-29