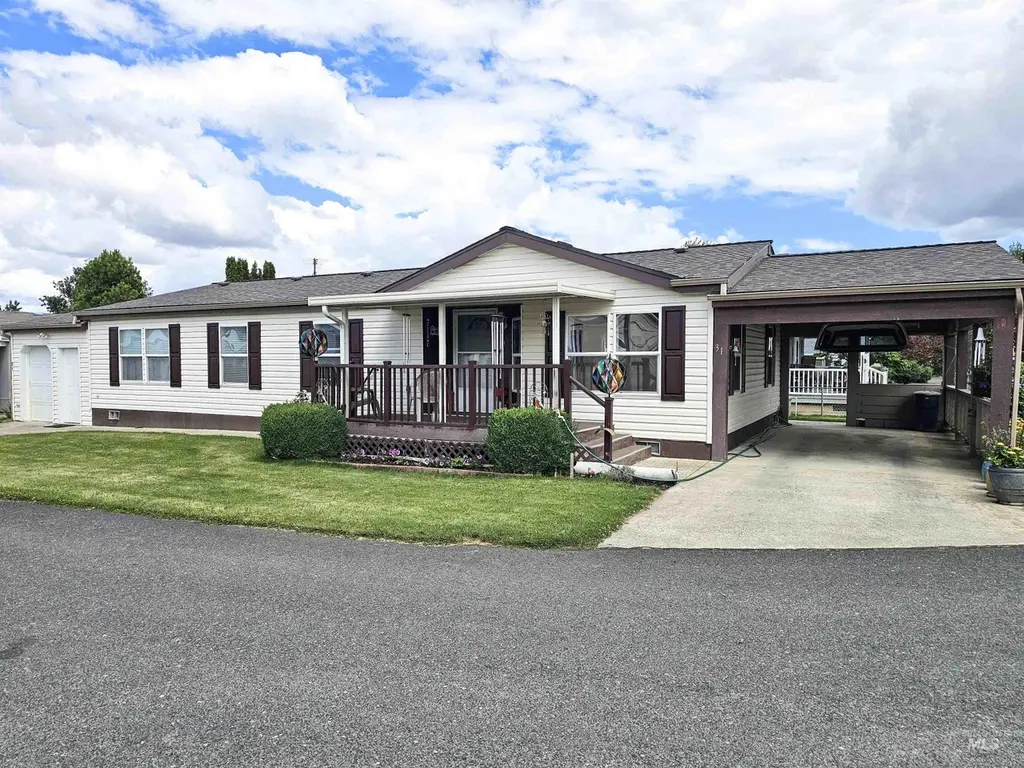
2034 Powers Ave #31 · Lewiston, ID
Flood risk 1/10 · Minimal
- FEMA flood zone
- —
- Chance of flooding over 30 yrs
- 0.0%
- Est. flood insurance / yr
- —
Fire risk 4/10 · Minor
- Est. fire insurance / yr
- $584 – $1,086
Heat risk 4/10 · Minor
- Hot days now (above 97°F)
- 7 days/yr
- Hot days in 30 yrs
- 15 days/yr
Wind risk 1/10 · Minimal
- Chance of severe wind over 30 yrs
- —
Air-quality risk 8/10 · Major
- Unhealthy air days now
- 11 days/yr
- Unhealthy air days in 30 yrs
- 14 days/yr
Risk factors via First Street. Map © Google.
Why this score? — see what drove the D- grade
The composite is a weighted blend of 9 inputs, each scored 0–100. Each bar is that input's sub-score; the figure is the points it added to the 100-point composite (weight × sub-score).
- Cash flow +12.9/30.0
- ARV discount +7.5/15.0
- Schools +4.2/10.0
- DSCR +3.9/10.0
- Livability +3.8/5.0
- 1% rule +2.6/10.0
- Rent growth +2.5/5.0
- Condition / age +2.5/5.0
- Appreciation +0.0/10.0
$175,000
🖨 Deal sheet 📄 Offer letter ✓ Due diligence
Listing remarks
"It's good to be home" in this well-loved 3 bedroom/2 bathroom mobile home in the Lewiston Orchards. Offering 1,404 square feet of comfortable living space, this inviting home is filled with a ton of natural light! The spacious primary suite features a walk-in closet, while the functional floor plan provides plenty of room for everyday living. Recent improvements offer peace of mind, including a new 50-year roof with a transferable warranty installed (2024), a new water heater (2021), and brand-new refrigerator, dishwasher, and washing machine. This home also features a covered front porch, raised garden beds, sprinklers, and an attached workshop that's perfect for hobbies, storag
Key facts
- Walk-in closet
- New water heater
- New refrigerator
Tags
Property features AI
Finance
- HOA & community: Located in Autumn Wood mobile home park
Exterior
- Parking: Covered 2-car carport; Finished driveway; Total parking for 2 vehicles
- Utilities: City water service; Sewer connected
- Home design: Mobile/manufactured home on a rented lot; Built in 2001
- Construction: Metal siding; Composition roof
- Exterior features: Covered patio/deck; Skylight(s); Garden; Corner lot; Automatic sprinkler system; Full sprinkler system; Paved road access; Located in a mobile home park
Interior
- Kitchen: Dishwasher; Disposal; Microwave; Freestanding oven/range; Refrigerator; Gas range; Kitchen island; Pantry; Laminate counters
- Bedrooms: 3 bedrooms — all on the main level
- Flooring: Laminate flooring; Vinyl flooring
- Bathrooms: 2 bathrooms
- Heating & cooling: Forced air heating (natural gas); Central air conditioning
- Interior features: Primary bedroom with en-suite bath; Family room; Walk-in closet(s); Pantry; Kitchen island; Laminate counters
- Laundry & utility: Washer and dryer included; Gas water heater; Tank water heater; Utility room on the main level
Neighborhood map
What this means for you Summary
Snapshot
- This is a 3-bed/2.0-bath manufactured listed at $175k.
Deal economics
- At list price, monthly cash flow is $-13 ($-151/yr) — negative.
- To cash-flow at today's rent, offer at most $173k (1.3% below list).
- To meet the 1% rule (rent ≥ 1% of price), the offer needs to be $133k (23.8% below list).
- Recommended offer: $133k (23.8% below list) — sets the bar for 1% rule.
- Cap rate 6.2% vs local median 1.9% in Lewiston — top-decile yield for the area; either an underpriced asset or a hidden risk that comps aren't pricing in. Stress-test before assuming the spread holds.
Location & tenants
- Location reads 75/100 on livability (#30 in ID, #4,281 nationally) — a middle-class / working-renter tenant base. Strengths: housing A+, health & safety A+, cost of living A; Watch: amenities F, commute F.
- Lewiston Independent District (urban): math 44% / reading 54% proficiency, ranked #37 of 92 in ID (top 40%) — families likely to look elsewhere, expect single-tenant / working-renter base with shorter leases.
- Zoned schools: Camelot Elementary School (math 57% / reading 52%, grade C, #106 of 357 statewide, top 33%, 352 students, 11% FRL); Lewiston High School (math 37% / reading 63%, grade D+, #39 of 169 statewide, top 23%, 1,373 students, 17% FRL) — zoned schools average 14% FRL vs 29% district-wide (15 pts lower); this property's tenant base skews higher-income than the district average.
- Market conditions: 272 active listings in the ZIP; 125 units permitted in Nez Perce County in 2024 (0 in 5+ unit buildings).
Forward outlook
- Local home prices are declining (-3.0%/yr); year-one equity from $1k of loan paydown is wiped out by about $5k of value loss. Plan a longer hold.
- Nez Perce County population projected at +12% by 2050 — modest demand growth; plan on rents tracking national, not racing it.
Negotiation context
- Only 8 days on market — expect competitive offers; lowballing is unlikely to land.
- 2 sale attempts since 11y ago with the ask held roughly flat each time — persistent listings suggest the price (not the market) is what's stuck; bring a comps-based counter.
Questions for the listing agent
- What do current leases actually rent for vs. the listed asking? Can we see a recent rent roll and the last 12 months of T-12 income?
- Is there a deadline driving the sale (1031 exchange, divorce, estate, relocation)? That informs how much negotiation room exists.
- The area grade is low — what's the realistic commute time and amenity access for the typical tenant pool here? Any planned neighborhood developments (good or bad) we should know about?
- What's the average days-on-market for RENTAL listings here right now (not sales)? A rising rental-DOM trend means longer vacancies and softer asking-rent achievability than the comps imply.
- What's the recent tenant-quality profile in this submarket — average credit score on applications, eviction rate, late-payment / NSF rate, and stable-employment percentage? A property-management company in the area should have these aggregated.
- How much new for-sale + rental construction is in the pipeline within 1–3 miles? Heavy new supply typically softens prices + rents 12–24 months out; constrained supply supports both.
Investment metrics
- 1% rule
- 0.76% ✗
- Cap rate
- 6.21%
- Cash-on-cash
- -0.31%
- DSCR
- 0.99
- GRM
- 10.9
CMA / ARV
- ARV (on-the-fly)
- $416,448
- Comps found
- 1
Show comp detail 1 sale within ~0.75 mi
| Address | Dist | Beds/Ba | Sqft | Sold | Price | $/sf | Match |
|---|---|---|---|---|---|---|---|
| 1832 Grelle Ave | 0.58mi | 4/2.0 (+1) | 1,620 (-6%) | 7mo | $390,000 | $241 | 51 |
Match score weights: distance 35% · size 25% · config 20% · recency 20%. Top-matched comps best support the ARV.
Projected returns pro-forma
-3.0% appreciation · 3.0% rent growth · sell at horizon
- IRR
- -16.9%
- Equity multiple
- 0.40×
- Total profit
- $-29,225
- Equity at exit
- $26,093
- IRR
- -8.8%
- Equity multiple
- 0.45×
- Total profit
- $-26,753
- Equity at exit
- $15,131
Cash invested: $49,000 (down + closing). Projections, not guarantees.
Landlord ↔ Tenant lean methodology
- Overall (STATE)
- 91 Strongly Landlord-Friendly
- State Idaho
- 91 Strongly Landlord-Friendly · R+18
- County
- — inherits STATE
- City
- — inherits STATE
ZIP-level market 83501
- Active inventory
- 272
- Price-to-rent
- 10.9×
Monthly cashflow live
- Estimated rent
- $1,334 medium interval (Pro) →
- Mortgage (P&I)
- −$918
- Tax from tax record
- −$76 /mo · $909/yr
- Insurance
- −$73
- HOA
- −$0
- Vacancy / Maint / Mgmt
- −$280
- Net cashflow
- $-13
Break-even live
UW: 25.0% down · 7.5% · 30yr · 1.5% tax · 5.0% vac · 8.0% maint · 8.0% mgmt
Financing live
Cash to close
- Down payment
- $43,750
- Closing costs
- $5,250
- Reserves months
- —
- Total cash needed
- —
Loan-product check · same deal, 3 products live
Conventional
25% down · 7.5% · 30yr
- Down + closing
- —
- Monthly P&I
- —
- Monthly cashflow
- —
- DSCR
- —
- Eligible?
- —
Personal DTI + credit; lowest rate.
DSCR
20% down · 8.5% · 30yr
- Down + closing
- —
- Monthly P&I
- —
- Monthly cashflow
- —
- DSCR
- —
- Eligible?
- —
No personal income docs; deal must DSCR.
Hard money
10% down · 12.0% · 12mo
- Down + closing
- —
- Monthly P&I
- —
- Monthly cashflow
- —
- DSCR
- —
- Eligible?
- —
Short-term bridge; refi at stabilization.
Listing history 8 events
-
2026-06-19days on market $175,000 Active 8 DOM
-
2026-06-18days on market $175,000 Active 7 DOM
-
2026-06-17days on market $175,000 Active 6 DOM
-
2026-06-16days on market $175,000 Active 5 DOM
-
2026-06-15days on market $175,000 Active 4 DOM
-
2026-06-14days on market $175,000 Active 2 DOM
-
2026-06-12remarks 689-char remark
-
2026-06-12$175,000 Active 1 DOM
ⓘ Source: listings_history table (triggers on properties + properties_extension) + one-shot
backfill from property_details.listing_events for pre-trigger history.
Tax reassessment forecast ID · Resets to sale price
- Current annual tax
- $909 · $76/mo
- Projected year-2 tax
- $1,208 · $101/mo
- Expected delta
- +$298/yr (+$25/mo · 32.8%)
ⓘ Screening estimate from a state-policy table — verify with the county assessor before closing.
Climate risk First Street
- Flood 1/10 Low 0% chance over 30 yrs
- Wildfire 4/10 Moderate
- Heat 4/10 Moderate 7 d/yr ≥97°F today · 15 d/yr by 30 yrs out
- Wind 1/10 Low
- Air quality 8/10 Severe 11 unhealthy d/yr today · 14 by 30 yrs out
Nearby sold comps map
Loading sold comps map…
Walkable amenities ~0.75 mi
Loading nearby amenities…
Taxation est. · year 1
- Rental income
- $16,008
- − Mortgage interest
- −$9,803
- − Property taxes
- −$909
- − Insurance
- −$875
- − Repairs & maintenance
- −$1,281
- − Management
- −$1,281
- − Depreciation
- −$5,091
- Taxable loss
- −$3,231
- Est. tax savings @ 24.0%
- +$775
- After-tax cash flow
- $625/yr
For passive investors: Depreciation is non-cash, so a rental often shows a tax loss while cash-flowing — sheltering income. Rental losses are passive: they offset passive income freely, and up to $25,000/yr can offset ordinary (W-2) income if you actively participate and your MAGI is under $100k (phasing out to $0 by $150k); unused losses carry forward. On sale, claimed depreciation is recaptured at up to 25%, and gains may owe capital-gains tax (a 1031 exchange can defer both). Figures are a year-1 estimate at your 24.0% rate — not tax advice; consult a CPA.
Schools (NCES district)
- District
- Lewiston Independent District
- NCES district ID
- 1601860
- Math proficiency
- 44% ▬ 0.00%
- Reading proficiency
- 54% ▬ 0.00%
- Median HH income
- $47,224
- Composite
- 41.65/100
- National rank
- #3423
- State rank
- #37 of 92 in ID
Livability — Lewiston
- Score
- 75/100
- State rank
- #30
- US rank
- #4281
Category grades
Schools grade is shown separately in the Schools card above.
Census & demographics
- Census place
- Lewiston, ID
- County
- Nez Perce County · 37,520 people
- City population
- 37,520
- Metro
- Lewiston, ID-WA
- Population (ZIP)
- 37,520
- Household income
- $73,629
- Rent vs Own
- Severe rent burden
- 976.0
Population outlook (Nez Perce County) Hauer SSP2
- Today (2025)
- 42,583 people
- By 2030
- 43,754 · +2.7%
- By 2040
- 45,907 · +7.8%
- By 2050
- 47,819 · +12.3%
- By 2075
- 53,100 · +24.7%
- By 2100
- 55,971 · +31.4%
Race, ethnicity, and origin ACS 2023
- Neighborhood character
- Predominantly White (89%)
- Race & ethnicity
- White 89% Two or more races 5% Hispanic / Latino 5% Native American 2%
- Common ancestry
- Portuguese 6% Slovak 3% Lithuanian 3%
- Foreign-born
- 2% · Canada
- Languages at home
- 97% English-only · Spanish 2%
Political lean MEDSL · Nez Perce
- 2024 margin
- Solid R (+38.6) · D 29.4% · R 68.1% · Other 2.5%
- 2008→2024 swing
- -20.5pp toward R · 2008: -18.1pp · 2024: -38.6pp
- All cycles
- 2024: R+38.6 2020: R+33.6 2016: R+34.1 2012: R+20.9 2008: R+18.1
Not yet ingested
- Civics
- —
Market trends
- HPI YoY
- ▼ -352.77%
- Current HPI
- 229.4958
- Rent YoY
- —
- Metro
- Lewiston, ID-WA
- State GDP YoY
- ▲ 4.51%
- F500 in state
- 6
Industry mix (Fortune 500 HQ in ID)
| Industry | F500 HQs | Revenue |
|---|---|---|
| Retail | 1 | $79B |
|
||
| Technology | 1 | $25B |
|
||
| Food / Agriculture | 1 | $6B |
|
||
Price history
+121.5% since first listed3 events — show timeline
- 2026-06-11 Listed $175,000 IMLS
- 2015-12-02 Sold (MLS) — IMLS
- 2015-11-02 Listed $79,000 IMLS
Property tax history
+73.0%/yrLatest (2019): $909 · +736.7% YoY. Source: county tax records.
Cash-flow waterfall
monthlySold comps — $/sqft
last 12 mo · ≤1 miLoading sold comps…