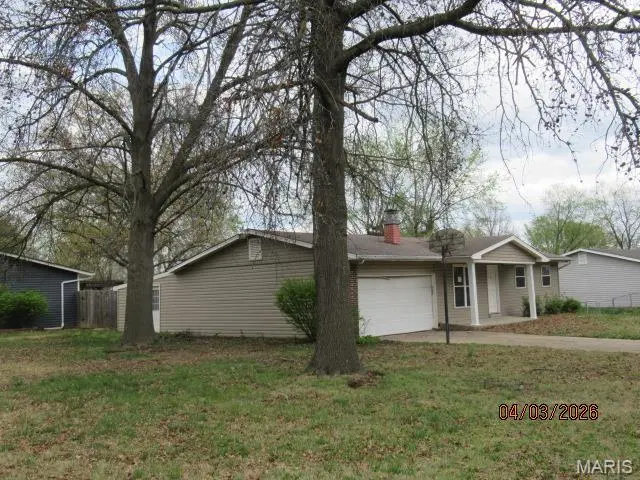
3535 Ridgewood Dr
St. Peters, MO 63303
$142,500B
3 bd · 2.0 ba ·
1,304 sqft ·
Built 1972
· SingleFamily
· Pending
· 8 DOM
Cashflow @ list (25.0% down · 7.5%)
Estimated rent
$2,263/mo
Mortgage (P&I)
−$747
Tax + insurance
−$254
HOA
−$0
Vac / Maint / Mgmt
−$475
Net cashflow
$787/mo
Annual
$9,440/yr
Cap rate
12.92%
Cash-on-cash
23.66%
DSCR
2.05
1% rule
1.59%
Cash to close
$39,900
Investor read
- This is a 3-bed/2.0-bath single-family listed at $142k.
- At list price, monthly cash flow is $787 ($9k/yr) — positive.
- The deal already cash-flows at list — no discount required.
- Meets the 1% rule at list price ($2k rent vs $142k).
- Only 8 days on market — expect competitive offers; lowballing is unlikely to land.
- Local home prices are declining (-3.0%/yr); year-one equity from $985 of loan paydown is wiped out by about $4k of value loss. Plan a longer hold.
- Location reads: area grade B — affects rentability + tenant quality, not the cash-flow math above.
- Francis Howell R-III (suburban): math 53% / reading 63% proficiency, ranked #11 of 324 in MO (top 3%) — acceptable for families but not a draw, mixed tenant base, ~2y average lease; only 15% free/reduced lunch — higher-income household profile.
- Zoned schools: Castlio Elem. (math 59% / reading 65%, grade B, #98 of 1,115 statewide, top 10%, 818 students, 12% FRL); Francis Howell North High (math 40% / reading 55%, grade D, #154 of 521 statewide, top 29%, 1,679 students, 19% FRL) — zoned schools at 15% FRL track the district average.
- Market conditions: Rents rising (+3.3%/yr); 192 active listings in the ZIP; 10 comparable units currently listed for rent nearby; rentals at typical pace (median 22d on market — plan ~3-4 weeks tenant-placement turnaround); 40% of comp listings sitting > 30 days — soft ceiling on asking rent; solid renter incomes; 2,021 units permitted in St. Charles County in 2024 (568 in 5+ unit buildings).
- St. Charles County population projected at +22% by 2050 — long-run rental-demand tailwind backs the buy-and-hold thesis.
- 4 sale attempts with the ask held roughly flat each time — persistent listings suggest the price (not the market) is what's stuck; bring a comps-based counter.
- At projected returns (-3.0% appreciation + 3.3% rent growth), your $40k cash investment doubles in ~6 years — after that, you're playing with house money.
- Climate carrying-cost: extreme-heat days projected 7→20/yr by 2055 (HVAC capex compounding) — expect insurance premiums to compound above CPI over the hold.
- Cap rate 12.9% vs local median 4.2% in St. Peters — top-decile yield for the area; either an underpriced asset or a hidden risk that comps aren't pricing in. Stress-test before assuming the spread holds.
Questions for listing agent
- Built in 1972 — when were the roof, HVAC, electrical panel, plumbing, and water heater last replaced?
- Is there a deadline driving the sale (1031 exchange, divorce, estate, relocation)? That informs how much negotiation room exists.
- What's the average days-on-market for RENTAL listings here right now (not sales)? A rising rental-DOM trend means longer vacancies and softer asking-rent achievability than the comps imply.
- What's the recent tenant-quality profile in this submarket — average credit score on applications, eviction rate, late-payment / NSF rate, and stable-employment percentage? A property-management company in the area should have these aggregated.
- How much new for-sale + rental construction is in the pipeline within 1–3 miles? Heavy new supply typically softens prices + rents 12–24 months out; constrained supply supports both.
CashFlowRE · CFR-T2DNXR331T0V7K
· Data 3 weeks ago
cashflowre.app · 2026-05-29