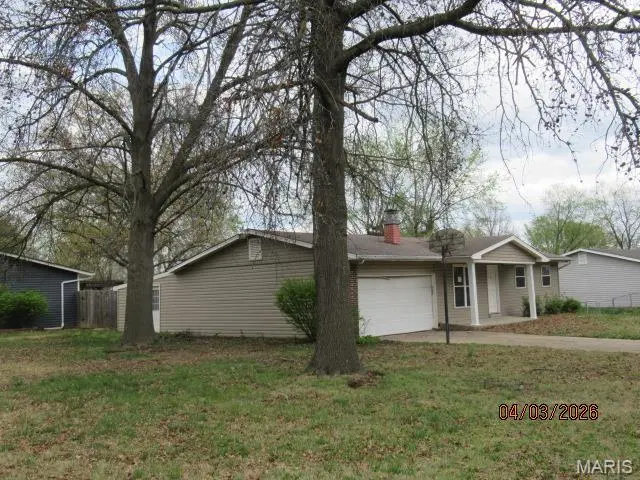
3535 Ridgewood Dr · St. Peters, MO
Flood risk 1/10 · Minimal
- FEMA flood zone
- X (unshaded)
- Chance of flooding over 30 yrs
- 0.0%
- Est. flood insurance / yr
- $473 – $860
Fire risk 1/10 · Minimal
- Est. fire insurance / yr
- $1,054 – $1,958
Heat risk 5/10 · Moderate
- Hot days now (above 107°F)
- 7 days/yr
- Hot days in 30 yrs
- 20 days/yr
Wind risk 2/10 · Minimal
- Chance of severe wind over 30 yrs
- 1.0%
Air-quality risk 2/10 · Minimal
- Unhealthy air days now
- 2 days/yr
- Unhealthy air days in 30 yrs
- 2 days/yr
Risk factors via First Street. Map © Google.
Why this score? — see what drove the B grade
The composite is a weighted blend of 9 inputs, each scored 0–100. Each bar is that input's sub-score; the figure is the points it added to the 100-point composite (weight × sub-score).
- Cash flow +30.0/30.0
- 1% rule +10.0/10.0
- DSCR +10.0/10.0
- ARV discount +7.5/15.0
- Schools +5.2/10.0
- Rent growth +3.3/5.0
- Livability +2.5/5.0
- Condition / age +2.5/5.0
- Appreciation +0.0/10.0
$142,500
🖨 Deal sheet 📄 Offer letter ✓ Due diligence
Listing remarks
Looking for a project? Attention investors / rehabbers / flippers! As-is sale on this ranch home. Some updates complete. Substantial foundation repair needed. Come take a look!
Key facts
- 9,426 sq ft lot
- 2 garage spots
- Built 1972
Neighborhood map
What this means for you Summary
Snapshot
- This is a 3-bed/2.0-bath single-family listed at $142k.
Deal economics
- At list price, monthly cash flow is $787 ($9k/yr) — positive.
- The deal already cash-flows at list — no discount required.
- Meets the 1% rule at list price ($2k rent vs $142k).
- Cap rate 12.9% vs local median 4.2% in St. Peters — top-decile yield for the area; either an underpriced asset or a hidden risk that comps aren't pricing in. Stress-test before assuming the spread holds.
Location & tenants
- Location reads: area grade B — affects rentability + tenant quality, not the cash-flow math above.
- Francis Howell R-III (suburban): math 53% / reading 63% proficiency, ranked #11 of 324 in MO (top 3%) — acceptable for families but not a draw, mixed tenant base, ~2y average lease; only 15% free/reduced lunch — higher-income household profile.
- Zoned schools: Castlio Elem. (math 59% / reading 65%, grade B, #98 of 1,115 statewide, top 10%, 818 students, 12% FRL); Francis Howell North High (math 40% / reading 55%, grade D, #154 of 521 statewide, top 29%, 1,679 students, 19% FRL) — zoned schools at 15% FRL track the district average.
- Market conditions: Rents rising (+3.3%/yr); 192 active listings in the ZIP; 10 comparable units currently listed for rent nearby; rentals at typical pace (median 22d on market — plan ~3-4 weeks tenant-placement turnaround); 40% of comp listings sitting > 30 days — soft ceiling on asking rent; solid renter incomes; 2,021 units permitted in St. Charles County in 2024 (568 in 5+ unit buildings).
Forward outlook
- Local home prices are declining (-3.0%/yr); year-one equity from $985 of loan paydown is wiped out by about $4k of value loss. Plan a longer hold.
- St. Charles County population projected at +22% by 2050 — long-run rental-demand tailwind backs the buy-and-hold thesis.
- At projected returns (-3.0% appreciation + 3.3% rent growth), your $40k cash investment doubles in ~6 years — after that, you're playing with house money.
Negotiation context
- Only 8 days on market — expect competitive offers; lowballing is unlikely to land.
- 4 sale attempts with the ask held roughly flat each time — persistent listings suggest the price (not the market) is what's stuck; bring a comps-based counter.
Risks & watch-outs
- Climate carrying-cost: extreme-heat days projected 7→20/yr by 2055 (HVAC capex compounding) — expect insurance premiums to compound above CPI over the hold.
Questions for the listing agent
- Built in 1972 — when were the roof, HVAC, electrical panel, plumbing, and water heater last replaced?
- Is there a deadline driving the sale (1031 exchange, divorce, estate, relocation)? That informs how much negotiation room exists.
- What's the average days-on-market for RENTAL listings here right now (not sales)? A rising rental-DOM trend means longer vacancies and softer asking-rent achievability than the comps imply.
- What's the recent tenant-quality profile in this submarket — average credit score on applications, eviction rate, late-payment / NSF rate, and stable-employment percentage? A property-management company in the area should have these aggregated.
- How much new for-sale + rental construction is in the pipeline within 1–3 miles? Heavy new supply typically softens prices + rents 12–24 months out; constrained supply supports both.
Investment metrics
- 1% rule
- 1.59% ✓
- Cap rate
- 12.92%
- Cash-on-cash
- 23.66%
- DSCR
- 2.05
- GRM
- 5.2
CMA / ARV
- ARV (on-the-fly)
- $285,576
- Comps found
- 12
Show comp detail 12 sales within ~0.75 mi
| Address | Dist | Beds/Ba | Sqft | Sold | Price | $/sf | Match |
|---|---|---|---|---|---|---|---|
| 3535 Ridgewood Dr | 0.00mi | 3/2.0 | 1,304 (0%) | 1mo | $142,500 | $109 | 99 |
| 3418 Wexford Dr | 0.16mi | 3/2.0 | 1,320 (+1%) | 4mo | $275,000 | $208 | 87 |
| 25 Robert Dr | 0.40mi | 3/1.5 | 1,296 (-1%) | 0mo | $274,900 | $212 | 78 |
| 1002 Arlington Dr | 0.35mi | 3/2.0 | 1,280 (-2%) | 8mo | $325,000 | $254 | 74 |
| 1124 Saratoga Dr | 0.14mi | 3/2.0 | 1,468 (+13%) | 8mo | $315,000 | $215 | 66 |
| 1059 Arlington Dr | 0.19mi | 3/2.5 | 1,477 (+13%) | 14mo | $275,000 | $186 | 55 |
| 1354 Nutmeg Dr | 0.69mi | 3/2.0 | 1,333 (+2%) | 11mo | $320,000 | $240 | 55 |
| 1221 Caulks Hill Rd | 0.47mi | 3/2.5 | 1,144 (-12%) | 7mo | $265,000 | $232 | 50 |
| 3948 Lexington Dr | 0.64mi | 3/2.0 | 1,120 (-14%) | 7mo | $245,000 | $219 | 41 |
| 3842 Duchess Dr | 0.60mi | 3/2.0 | 1,120 (-14%) | 13mo | $269,900 | $241 | 38 |
| 3628 Coriander Dr | 0.72mi | 3/2.0 | 1,140 (-13%) | 14mo | $274,900 | $241 | 34 |
| 3629 Coriander Dr | 0.74mi | 3/2.0 | 1,464 (+12%) | 16mo | $240,000 | $164 | 32 |
Match score weights: distance 35% · size 25% · config 20% · recency 20%. Top-matched comps best support the ARV.
Projected returns pro-forma
-3.0% appreciation · 3.27% rent growth · sell at horizon
- IRR
- 17.1%
- Equity multiple
- 1.69×
- Total profit
- $27,671
- Equity at exit
- $21,247
- IRR
- 25.8%
- Equity multiple
- 3.29×
- Total profit
- $91,333
- Equity at exit
- $12,321
Cash invested: $39,900 (down + closing). Projections, not guarantees.
Landlord ↔ Tenant lean methodology
- Overall (STATE)
- 81 Strongly Landlord-Friendly
- State Missouri
- 81 Strongly Landlord-Friendly · R+10
- County
- — inherits STATE
- City
- — inherits STATE
ZIP-level market 63303
- Rents YoY
- 3.3%
- Active inventory
- 192
- Price-to-rent
- 5.2×
Monthly cashflow live
- Estimated rent
- $2,263 high interval (Pro) →
- Mortgage (P&I)
- −$747
- Tax from tax record
- −$195 /mo · $2,337/yr
- Insurance
- −$59
- HOA
- −$0
- Vacancy / Maint / Mgmt
- −$475
- Net cashflow
- $787
Break-even live
UW: 25.0% down · 7.5% · 30yr · 1.5% tax · 5.0% vac · 8.0% maint · 8.0% mgmt
Financing live
Cash to close
- Down payment
- $35,625
- Closing costs
- $4,275
- Reserves months
- —
- Total cash needed
- —
Loan-product check · same deal, 3 products live
Conventional
25% down · 7.5% · 30yr
- Down + closing
- —
- Monthly P&I
- —
- Monthly cashflow
- —
- DSCR
- —
- Eligible?
- —
Personal DTI + credit; lowest rate.
DSCR
20% down · 8.5% · 30yr
- Down + closing
- —
- Monthly P&I
- —
- Monthly cashflow
- —
- DSCR
- —
- Eligible?
- —
No personal income docs; deal must DSCR.
Hard money
10% down · 12.0% · 12mo
- Down + closing
- —
- Monthly P&I
- —
- Monthly cashflow
- —
- DSCR
- —
- Eligible?
- —
Short-term bridge; refi at stabilization.
Rent comps 10 comps
| Address | Beds | Baths | Sqft | Rent | $/sqft | DOM | Units | Dist |
|---|---|---|---|---|---|---|---|---|
| 3515 Ridgewood Dr Saint Charles, MO | 3.0 | 2.5 | 1677 | $2,535 | $1.51 | 4d | 1 | 0.05mi |
| 2970 Aintree Dr Saint Charles, MO | 3.0 | 2.0 | 1318 | $2,380 | $1.81 | 43d | 1 | 0.90mi |
| 3891 Cambridge Crossing Dr Saint Charles, MO | 3.0 | 2.0 | 1509 | $2,396 | $1.59 | 4d | 1 | 1.02mi |
| 3039 Plum Creek Dr Saint Peters, MO | 3.0 | 2.0 | 1300 | $2,180 | $1.68 | 21d | 1 | 1.02mi |
| 145 Sesame Loop Unit 1 St Charles, MO | 3.0 | 2.5 | 1869 | $2,450 | $1.31 | 7d | 1 | 1.07mi |
| 1321 Forest Creek Dr St Peters, MO | 2.0 | 1.0 | 1359 | $2,000 | $1.47 | 43d | 1 | 1.19mi |
| 3212 Stonehenge Dr Saint Charles, MO | 3.0 | 2.0 | 1189 | $2,000 | $1.68 | 43d | 1 | 1.28mi |
| 1000 Jasper Ln St Peters, MO | 1.0–3.0 | 1.0–2.0 | 1047 | $2,332 | $2.23 | 1d | 12 | 1.30mi |
| 100 Broadridge Dr St Peters, MO | 1.0–2.0 | 1.0–2.0 | 845 | $1,648 | $1.95 | 1d | 10 | 1.48mi |
| 531 Saravalle Dr Saint Peters, MO | 2.0 | 2.0 | 1012 | $1,650 | $1.63 | 43d | 1 | 1.49mi |
Listing history 15 events
-
2026-04-16status Pending
-
2026-04-08$142,500 Active
-
2025-11-12status Pending
-
2025-10-31status Active
-
2025-10-09status Pending
-
2025-09-03$199,900 Active
-
2025-09-03historical
-
2025-05-03$274,900 Active
-
2024-02-07soldstatus $194,000
-
1999-07-14soldstatus $80,000
-
1995-03-01soldstatus
-
1993-06-01soldstatus $65,500
-
1991-08-01soldstatus $65,000
-
1986-04-01soldstatus
-
1983-05-01soldstatus $58,000
ⓘ Source: listings_history table (triggers on properties + properties_extension) + one-shot
backfill from property_details.listing_events for pre-trigger history.
Tax reassessment forecast MO · Resets to sale price
- Current annual tax
- $2,337 · $195/mo
- Projected year-2 tax
- $2,337 · $195/mo
- Expected delta
- $0/yr ($0/mo · 0.0%)
ⓘ Screening estimate from a state-policy table — verify with the county assessor before closing.
Climate risk First Street
- Flood 1/10 Low FEMA zone X (unshaded) · 0% chance over 30 yrs
- Wildfire 1/10 Low
- Heat 5/10 Major 7 d/yr ≥107°F today · 20 d/yr by 30 yrs out
- Wind 2/10 Low 100% chance of damaging wind over 30 yrs
- Air quality 2/10 Low 2 unhealthy d/yr today · 2 by 30 yrs out
Nearby sold comps map
Loading sold comps map…
Walkable amenities ~0.75 mi
Loading nearby amenities…
Taxation est. · year 1
- Rental income
- $27,160
- − Mortgage interest
- −$7,982
- − Property taxes
- −$2,337
- − Insurance
- −$712
- − Repairs & maintenance
- −$2,173
- − Management
- −$2,173
- − Depreciation
- −$4,145
- Taxable income
- $7,637
- Est. tax owed @ 24.0%
- −$1,833
- After-tax cash flow
- $7,607/yr
For passive investors: Depreciation is non-cash, so a rental often shows a tax loss while cash-flowing — sheltering income. Rental losses are passive: they offset passive income freely, and up to $25,000/yr can offset ordinary (W-2) income if you actively participate and your MAGI is under $100k (phasing out to $0 by $150k); unused losses carry forward. On sale, claimed depreciation is recaptured at up to 25%, and gains may owe capital-gains tax (a 1031 exchange can defer both). Figures are a year-1 estimate at your 24.0% rate — not tax advice; consult a CPA.
Schools (NCES district)
- District
- Francis Howell R-III
- NCES district ID
- 2928950
- Math proficiency
- 53% ▼ -12.00%
- Reading proficiency
- 63% ▼ -5.00%
- Median HH income
- $79,768
- Composite
- 52.23/100
- National rank
- #1602
- State rank
- #11 of 324 in MO
Livability — St. Peters
No livability data for this city. (Only ~50 U.S. cities are tracked.)
Census & demographics
- County
- Saint Charles County · 399,703 people
- City population
- 74,876
- Metro
- St. Louis, MO-IL
- Population (ZIP)
- 46,089
- Household income
- $99,138
- Rent vs Own
- Severe rent burden
- 1026.0
Population outlook (St. Charles County) Hauer SSP2
- Today (2025)
- 437,857 people
- By 2030
- 461,707 · +5.4%
- By 2040
- 503,222 · +14.9%
- By 2050
- 534,684 · +22.1%
- By 2075
- 597,047 · +36.4%
- By 2100
- 609,682 · +39.2%
Race, ethnicity, and origin ACS 2023
- Neighborhood character
- Predominantly White (79%)
- Race & ethnicity
- White 79% Black 6% Asian 6% Two or more races 6% Hispanic / Latino 5%
- Common ancestry
- Lithuanian 3% Romanian 3% Slovak 2%
- Foreign-born
- 7% · Canada, China, South Korea
- Languages at home
- 91% English-only · Spanish 3% Other Indo-European 1% Other Asian/Pacific 1%
Political lean MEDSL · St. Charles
- 2024 margin
- R (+17.0) · D 40.8% · R 57.8% · Other 1.4%
- 2008→2024 swing
- -7.2pp toward R · 2008: -9.7pp · 2024: -17.0pp
- All cycles
- 2024: R+17.0 2020: R+17.5 2016: R+26.4 2012: R+21.0 2008: R+9.7
Not yet ingested
- Civics
- —
Market trends
- HPI YoY
- ▼ -260.84%
- Current HPI
- 224.7406
- Rent YoY
- ▲ 3.27%
- Metro
- St. Louis, MO-IL
- State GDP YoY
- ▲ 1.84%
- F500 in state
- 20
Industry mix (Fortune 500 HQ in MO)
| Industry | F500 HQs | Revenue |
|---|---|---|
| Healthcare | 1 | $163B |
|
||
| Insurance | 1 | $21B |
|
||
| Industrial Technology | 1 | $17B |
|
||
| Retail | 1 | $16B |
|
||
| Industrial Distribution | 1 | $10B |
|
||
| Utilities | 1 | $9B |
|
||
Price history
+145.7% since first listed15 events — show timeline
- 2026-04-16 Pending — MARIS as Distributed by MLS Grid
- 2026-04-08 Listed $142,500 MARIS as Distributed by MLS Grid
- 2025-11-12 Pending — MARIS as Distributed by MLS Grid
- 2025-10-31 Relisted — MARIS as Distributed by MLS Grid
- 2025-10-09 Pending — MARIS as Distributed by MLS Grid
- 2025-09-03 Listed $199,900 MARIS as Distributed by MLS Grid
- 2025-09-03 Coming Soon — MARIS as Distributed by MLS Grid
- 2025-05-03 Listed $274,900 MARIS as Distributed by MLS Grid
- 2024-02-07 Sold (Public Records) $194,000 Public Records
- 1999-07-14 Sold (Public Records) $80,000 Public Records
- 1995-03-01 Sold (Public Records) — Public Records
- 1993-06-01 Sold (Public Records) $65,500 Public Records
- 1991-08-01 Sold (Public Records) $65,000 Public Records
- 1986-04-01 Sold (Public Records) — Public Records
- 1983-05-01 Sold (Public Records) $58,000 Public Records
Property tax history
+2.5%/yrLatest (2025): $2,337 · +13.4% YoY. Source: county tax records.
Cash-flow waterfall
monthlySold comps — $/sqft
last 12 mo · ≤1 miLoading sold comps…