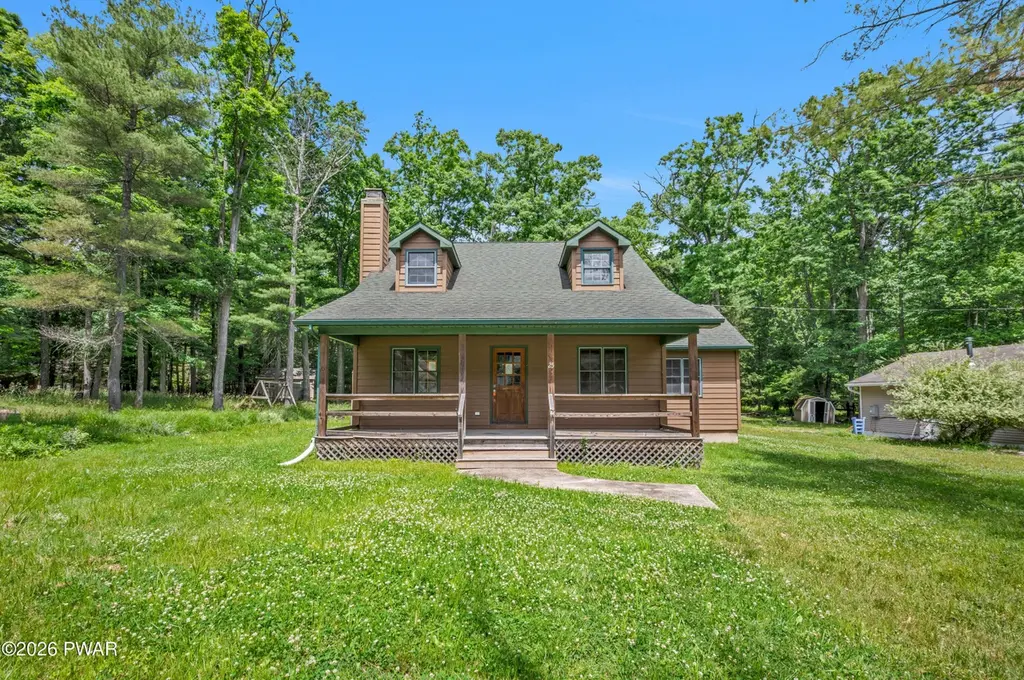
25 5th St
Hawley, PA 18428
$214,900C-
3 bd · 2.0 ba ·
1,709 sqft ·
Built 2006
· SingleFamily
· Active
· 7 DOM
Cashflow @ list (25.0% down · 7.5%)
Estimated rent
$2,089/mo
Mortgage (P&I)
−$1,127
Tax + insurance
−$581
HOA
−$0
Vac / Maint / Mgmt
−$439
Net cashflow
$-58/mo
Annual
$-696/yr
Cap rate
5.97%
Cash-on-cash
-1.16%
DSCR
0.95
1% rule
0.97%
Cash to close
$60,172
Investor read
- This is a 3-bed/2.0-bath single-family listed at $215k.
- At list price, monthly cash flow is $-58 ($-696/yr) — negative.
- To cash-flow at today's rent, offer at most $205k (4.8% below list).
- To meet the 1% rule (rent ≥ 1% of price), the offer needs to be $209k (2.8% below list).
- Only 7 days on market — expect competitive offers; lowballing is unlikely to land.
- Recommended offer: $205k (4.8% below list) — sets the bar for cash-flow.
- In year one you build about $23k of equity ($1k loan paydown + $21k appreciation (10.0% local appreciation)).
- Location reads 68/100 on livability (#898 in PA) — a middle-class / working-renter tenant base. Strengths: crime A+, cost of living A+, housing A; Watch: schools C-, amenities F, commute F.
- Wallenpaupack Area SD (rural): math 39% / reading 59% proficiency, ranked #192 of 539 in PA (top 36%) — families likely to look elsewhere, expect single-tenant / working-renter base with shorter leases.
- Watch-outs: property tax is 2.7% of price.
- Market conditions: 371 active listings in the ZIP; 2 comparable units currently listed for rent nearby; 177 units permitted in Wayne County in 2024 (0 in 5+ unit buildings).
- Wayne County population projected at -17% by 2050 — secular population decline; favor cash flow + early exit over multi-decade hold.
- 2 sale attempts with the ask held roughly flat each time — persistent listings suggest the price (not the market) is what's stuck; bring a comps-based counter.
- At projected returns (10.0% appreciation + 3.0% rent growth), your $60k cash investment doubles in ~3 years — after that, you're playing with house money.
- By year 2, paydown + projected appreciation supports a ~$37k cash-out refi (75% LTV) — recoverable capital for the next deal without selling this one.
- Cap rate 6.0% vs local median 4.0% in Hawley — top-decile yield for the area; either an underpriced asset or a hidden risk that comps aren't pricing in. Stress-test before assuming the spread holds.
Questions for listing agent
- What do current leases actually rent for vs. the listed asking? Can we see a recent rent roll and the last 12 months of T-12 income?
- Property tax is high relative to price — has the assessment been appealed recently, and will the sale trigger a re-assessment?
- Is there a deadline driving the sale (1031 exchange, divorce, estate, relocation)? That informs how much negotiation room exists.
- What's the average days-on-market for RENTAL listings here right now (not sales)? A rising rental-DOM trend means longer vacancies and softer asking-rent achievability than the comps imply.
- What's the recent tenant-quality profile in this submarket — average credit score on applications, eviction rate, late-payment / NSF rate, and stable-employment percentage? A property-management company in the area should have these aggregated.
- How much new for-sale + rental construction is in the pipeline within 1–3 miles? Heavy new supply typically softens prices + rents 12–24 months out; constrained supply supports both.
CashFlowRE · CFR-T2QEYV9KPKK773
· Data 2 days ago
cashflowre.app · 2026-05-29