25 5th St · Hawley, PA
Flood risk 1/10 · Minimal
- FEMA flood zone
- X (unshaded)
- Chance of flooding over 30 yrs
- 0.0%
- Est. flood insurance / yr
- $507 – $1,088
Fire risk 3/10 · Minor
- Est. fire insurance / yr
- $511 – $949
Heat risk 2/10 · Minimal
- Hot days now (above 92°F)
- 7 days/yr
- Hot days in 30 yrs
- 15 days/yr
Wind risk 2/10 · Minimal
- Chance of severe wind over 30 yrs
- 4.0%
Air-quality risk 2/10 · Minimal
- Unhealthy air days now
- 1 days/yr
- Unhealthy air days in 30 yrs
- 2 days/yr
Risk factors via First Street. Map © Google.
Why this score? — see what drove the C- grade
The composite is a weighted blend of 9 inputs, each scored 0–100. Each bar is that input's sub-score; the figure is the points it added to the 100-point composite (weight × sub-score).
- Cash flow +11.8/30.0
- Appreciation +10.0/10.0
- ARV discount +7.5/15.0
- 1% rule +4.7/10.0
- Schools +4.2/10.0
- DSCR +3.5/10.0
- Livability +3.4/5.0
- Rent growth +2.5/5.0
- Condition / age +2.5/5.0
$214,900
🖨 Deal sheet 📄 Offer letter ✓ Due diligence
Listing remarks
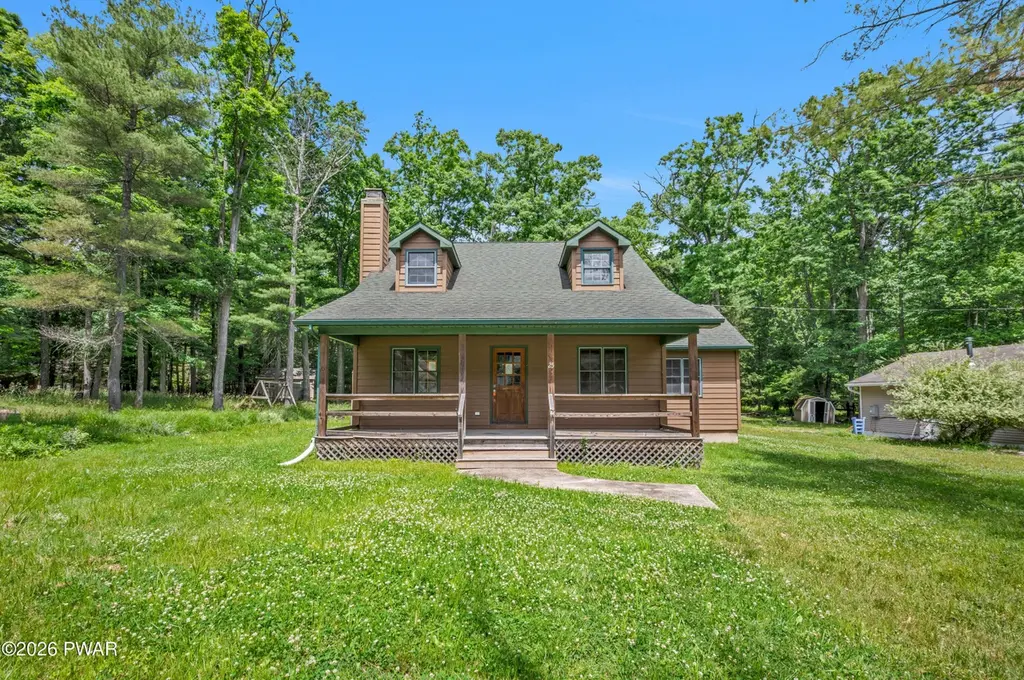
Set on a quiet street just minutes from Lake Wallenpaupack and downtown Hawley, this charming two-story home offers a blend of rustic character and modern potential. The exterior features warm wood siding, a covered porch, and a classic roofline with dormer windows that give the home its cozy, cabin-style appeal. Surrounded by mature trees and open lawn, the property feels private yet connected to everything the area has to offer. Inside, the open-concept layout highlights soaring ceilings, natural wood floors, and large arched windows that fill the space with light. The living room centers around a stone fireplace, creating a focal point that adds warmth and texture. The kitchen is bright,
Key facts
- Covered porch
- Wooded backdrop
- Stone fireplace
Tags
Property features AI
Exterior
- Parking: Detached garage; 1 garage space
- Utilities: Private well water; Private sewer; Electricity connected
- Home design: Single family residence; House; One and one-half stories
- Construction: Composition/shingle roof; Built as a house
- Exterior features: Porch; Few trees; Level lot; Private maintained road access; Private road frontage; Gravel and paved road surfaces; Has view
Interior
- Kitchen: Eat-in kitchen
- Bedrooms: Total rooms: 6; One and one-half levels (includes bedrooms on multiple levels)
- Flooring: Hardwood; Tile
- Bathrooms: 1 full bathroom; 1 half bathroom
- Interior features: Eat-in kitchen; High ceilings; Living room fireplace
- Laundry & utility: Crawl space basement
Neighborhood map
What this means for you Summary
Snapshot
- This is a 3-bed/2.0-bath single-family listed at $215k.
Deal economics
- At list price, monthly cash flow is $-58 ($-696/yr) — negative.
- To cash-flow at today's rent, offer at most $205k (4.8% below list).
- To meet the 1% rule (rent ≥ 1% of price), the offer needs to be $209k (2.8% below list).
- Recommended offer: $205k (4.8% below list) — sets the bar for cash-flow.
- Cap rate 6.0% vs local median 4.0% in Hawley — top-decile yield for the area; either an underpriced asset or a hidden risk that comps aren't pricing in. Stress-test before assuming the spread holds.
Location & tenants
- Location reads 68/100 on livability (#898 in PA) — a middle-class / working-renter tenant base. Strengths: crime A+, cost of living A+, housing A; Watch: schools C-, amenities F, commute F.
- Wallenpaupack Area SD (rural): math 39% / reading 59% proficiency, ranked #192 of 539 in PA (top 36%) — families likely to look elsewhere, expect single-tenant / working-renter base with shorter leases.
- Market conditions: 371 active listings in the ZIP; 2 comparable units currently listed for rent nearby; 177 units permitted in Wayne County in 2024 (0 in 5+ unit buildings).
Forward outlook
- In year one you build about $23k of equity ($1k loan paydown + $21k appreciation (10.0% local appreciation)).
- Wayne County population projected at -17% by 2050 — secular population decline; favor cash flow + early exit over multi-decade hold.
- At projected returns (10.0% appreciation + 3.0% rent growth), your $60k cash investment doubles in ~3 years — after that, you're playing with house money.
- By year 2, paydown + projected appreciation supports a ~$37k cash-out refi (75% LTV) — recoverable capital for the next deal without selling this one.
Negotiation context
- Only 7 days on market — expect competitive offers; lowballing is unlikely to land.
- 2 sale attempts with the ask held roughly flat each time — persistent listings suggest the price (not the market) is what's stuck; bring a comps-based counter.
Risks & watch-outs
- Watch-outs: property tax is 2.7% of price.
Questions for the listing agent
- What do current leases actually rent for vs. the listed asking? Can we see a recent rent roll and the last 12 months of T-12 income?
- Property tax is high relative to price — has the assessment been appealed recently, and will the sale trigger a re-assessment?
- Is there a deadline driving the sale (1031 exchange, divorce, estate, relocation)? That informs how much negotiation room exists.
- What's the average days-on-market for RENTAL listings here right now (not sales)? A rising rental-DOM trend means longer vacancies and softer asking-rent achievability than the comps imply.
- What's the recent tenant-quality profile in this submarket — average credit score on applications, eviction rate, late-payment / NSF rate, and stable-employment percentage? A property-management company in the area should have these aggregated.
- How much new for-sale + rental construction is in the pipeline within 1–3 miles? Heavy new supply typically softens prices + rents 12–24 months out; constrained supply supports both.
Investment metrics
- 1% rule
- 0.97% ✗
- Cap rate
- 5.97%
- Cash-on-cash
- -1.16%
- DSCR
- 0.95
- GRM
- 8.6
CMA / ARV
- ARV (on-the-fly)
- $454,594
- Comps found
- 3
Show comp detail 3 sales within ~0.75 mi
| Address | Dist | Beds/Ba | Sqft | Sold | Price | $/sf | Match |
|---|---|---|---|---|---|---|---|
| 26 Crescent Dr | 0.19mi | 3/2.0 | 1,800 (+5%) | 16mo | $479,000 | $266 | 69 |
| 1426 Purdytown Tpke | 0.48mi | 2/2.0 (-1) | 1,591 (-7%) | 6mo | $283,760 | $178 | 56 |
| 16 Lake View Rd | 0.32mi | 3/1.0 | 1,587 (-7%) | 22mo | $632,500 | $399 | 51 |
Match score weights: distance 35% · size 25% · config 20% · recency 20%. Top-matched comps best support the ARV.
Projected returns pro-forma
10.0% appreciation · 3.0% rent growth · sell at horizon
- IRR
- 23.5%
- Equity multiple
- 2.89×
- Total profit
- $113,517
- Equity at exit
- $193,599
- IRR
- 20.9%
- Equity multiple
- 6.61×
- Total profit
- $337,527
- Equity at exit
- $417,503
Cash invested: $60,172 (down + closing). Projections, not guarantees.
Landlord ↔ Tenant lean methodology
- Overall (STATE)
- 62 Landlord-Friendly
- State Pennsylvania
- 62 Landlord-Friendly · EVEN
- County
- — inherits STATE
- City
- — inherits STATE
ZIP-level market 18428
- Home prices YoY
- 9.2%
- Active inventory
- 371
- Price-to-rent
- 8.6×
Monthly cashflow live
- Estimated rent
- $2,089 medium interval (Pro) →
- Mortgage (P&I)
- −$1,127
- Tax from tax record
- −$491 /mo · $5,897/yr
- Insurance
- −$90
- HOA
- −$0
- Vacancy / Maint / Mgmt
- −$439
- Net cashflow
- $-58
Break-even live
UW: 25.0% down · 7.5% · 30yr · 1.5% tax · 5.0% vac · 8.0% maint · 8.0% mgmt
Financing live
Cash to close
- Down payment
- $53,725
- Closing costs
- $6,447
- Reserves months
- —
- Total cash needed
- —
Loan-product check · same deal, 3 products live
Conventional
25% down · 7.5% · 30yr
- Down + closing
- —
- Monthly P&I
- —
- Monthly cashflow
- —
- DSCR
- —
- Eligible?
- —
Personal DTI + credit; lowest rate.
DSCR
20% down · 8.5% · 30yr
- Down + closing
- —
- Monthly P&I
- —
- Monthly cashflow
- —
- DSCR
- —
- Eligible?
- —
No personal income docs; deal must DSCR.
Hard money
10% down · 12.0% · 12mo
- Down + closing
- —
- Monthly P&I
- —
- Monthly cashflow
- —
- DSCR
- —
- Eligible?
- —
Short-term bridge; refi at stabilization.
Rent comps 2 comps
| Address | Beds | Baths | Sqft | Rent | $/sqft | DOM | Units | Dist |
|---|---|---|---|---|---|---|---|---|
| 30 Lakeside Dr Lakeville, PA | 3.0 | 1.5 | 1611 | $2,500 | $1.55 | 7d | 1 | 1.36mi |
| 607 Church St Hawley, PA | 3.0 | 1.0 | 1210 | $1,500 | $1.24 | 24d | 1 | 1.46mi |
Listing history 7 events
-
2026-06-18days on market $214,900 Active 7 DOM
-
2026-06-17days on market $214,900 Active 6 DOM
-
2026-06-16days on market $214,900 Active 5 DOM
-
2026-06-15days on market $214,900 Active 4 DOM
-
2026-06-13days on market $214,900 Active 2 DOM
-
2026-06-13remarks 699-char remark
-
2026-06-13$214,900 Active 1 DOM
ⓘ Source: listings_history table (triggers on properties + properties_extension) + one-shot
backfill from property_details.listing_events for pre-trigger history.
Tax reassessment forecast PA · Partial reset (capped growth)
- Current annual tax
- $5,897 · $491/mo
- Projected year-2 tax
- $5,897 · $491/mo
- Expected delta
- $0/yr ($0/mo · 0.0%)
ⓘ Screening estimate from a state-policy table — verify with the county assessor before closing.
Climate risk First Street
- Flood 1/10 Low FEMA zone X (unshaded) · 0% chance over 30 yrs
- Wildfire 3/10 Moderate
- Heat 2/10 Low 7 d/yr ≥92°F today · 15 d/yr by 30 yrs out
- Wind 2/10 Low 4% chance of damaging wind over 30 yrs
- Air quality 2/10 Low 1 unhealthy d/yr today · 2 by 30 yrs out
Nearby sold comps map
Loading sold comps map…
Walkable amenities ~0.75 mi
Loading nearby amenities…
Taxation est. · year 1
- Rental income
- $25,063
- − Mortgage interest
- −$12,038
- − Property taxes
- −$5,897
- − Insurance
- −$1,074
- − Repairs & maintenance
- −$2,005
- − Management
- −$2,005
- − Depreciation
- −$6,252
- Taxable loss
- −$4,208
- Est. tax savings @ 24.0%
- +$1,010
- After-tax cash flow
- $314/yr
For passive investors: Depreciation is non-cash, so a rental often shows a tax loss while cash-flowing — sheltering income. Rental losses are passive: they offset passive income freely, and up to $25,000/yr can offset ordinary (W-2) income if you actively participate and your MAGI is under $100k (phasing out to $0 by $150k); unused losses carry forward. On sale, claimed depreciation is recaptured at up to 25%, and gains may owe capital-gains tax (a 1031 exchange can defer both). Figures are a year-1 estimate at your 24.0% rate — not tax advice; consult a CPA.
Schools (NCES district)
- District
- Wallenpaupack Area SD
- NCES district ID
- 4224750
- Math proficiency
- 39% ▼ -10.00%
- Reading proficiency
- 59% ▼ -5.00%
- Median HH income
- $51,027
- Composite
- 41.97/100
- National rank
- #3345
- State rank
- #192 of 539 in PA
Livability — Hawley
- Score
- 68/100
- State rank
- #898
- US rank
- #9570
Category grades
Schools grade is shown separately in the Schools card above.
Census & demographics
- Population (ZIP)
- 12,446
Population outlook (Wayne County) Hauer SSP2
- Today (2025)
- 47,924 people
- By 2030
- 46,191 · -3.6%
- By 2040
- 42,815 · -10.7%
- By 2050
- 39,873 · -16.8%
- By 2075
- 34,556 · -27.9%
- By 2100
- 28,358 · -40.8%
Race, ethnicity, and origin ACS 2023
- Neighborhood character
- Predominantly White (85%)
- Race & ethnicity
- White 85% Hispanic / Latino 8% Two or more races 6% Black 1% Asian 1%
- Hispanic origin (detail)
- Puerto Rican 5%
- Common ancestry
- Romanian 5% Portuguese 3% Italian 2%
- Foreign-born
- 5% · Canada
- Languages at home
- 91% English-only · Spanish 5% Russian/Polish/Slavic 1% Other Asian/Pacific 1%
Political lean MEDSL · Wayne
- 2024 margin
- Solid R (+37.1) · D 31.1% · R 68.2%
- 2008→2024 swing
- -24.8pp toward R · 2008: -12.3pp · 2024: -37.1pp
- All cycles
- 2024: R+37.1 2020: R+33.6 2016: R+39.7 2012: R+20.9 2008: R+12.3
Not yet ingested
- Civics
- —
Market trends
- HPI YoY
- ▲ 28.60%
- Current HPI
- 340.8254
- Rent YoY
- —
- Metro
- —
- State GDP YoY
- ▲ 1.68%
- F500 in state
- 34
Industry mix (Fortune 500 HQ in PA)
| Industry | F500 HQs | Revenue |
|---|---|---|
| Healthcare | 2 | $309B |
|
||
| Insurance | 2 | $27B |
|
||
| Telecommunications / Media | 1 | $124B |
|
||
| Industrial Distribution | 1 | $22B |
|
||
| Financial Services | 1 | $20B |
|
||
| Chemicals / Materials | 1 | $18B |
|
||
Price history
-43.5% since first listed9 events — show timeline
- 2026-06-11 Listed $214,900 PWMLS
- 2026-04-30 Listing Removed — BRIGHT MLS
- 2026-04-10 Price Changed $244,500 BRIGHT MLS
- 2026-03-16 Price Changed $265,100 BRIGHT MLS
- 2026-02-26 Price Changed $301,400 BRIGHT MLS
- 2026-02-11 Price Changed $334,000 BRIGHT MLS
- 2026-01-26 Price Changed $349,400 BRIGHT MLS
- 2026-01-08 Price Changed $376,200 BRIGHT MLS
- 2025-12-23 Listed $380,600 BRIGHT MLS
Property tax history
+5.8%/yrLatest (2026): $5,897 · +2.3% YoY. Source: county tax records.
Cash-flow waterfall
monthlySold comps — $/sqft
last 12 mo · ≤1 miLoading sold comps…