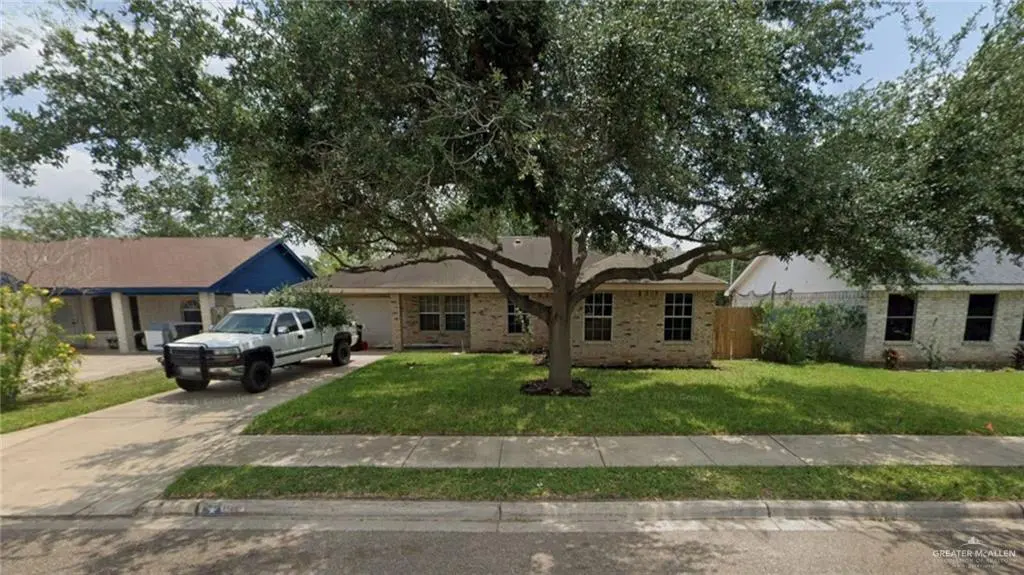
2201 Fullerton Ave
McAllen, TX 78504
$210,000F
3 bd · 2.0 ba ·
1,212 sqft ·
Built 2000
· SingleFamily
· Active
· 9 DOM
Cashflow @ list (25.0% down · 7.5%)
Estimated rent
$1,626/mo
Mortgage (P&I)
−$1,101
Tax + insurance
−$362
HOA
−$0
Vac / Maint / Mgmt
−$342
Net cashflow
$-178/mo
Annual
$-2,136/yr
Cap rate
5.28%
Cash-on-cash
-3.63%
DSCR
0.84
1% rule
0.77%
Cash to close
$58,800
Investor read
- This is a 3-bed/2.0-bath single-family listed at $210k.
- At list price, monthly cash flow is $-178 ($-2k/yr) — negative.
- To cash-flow at today's rent, offer at most $179k (15.0% below list).
- To meet the 1% rule (rent ≥ 1% of price), the offer needs to be $163k (22.6% below list).
- Only 9 days on market — expect competitive offers; lowballing is unlikely to land.
- Recommended offer: $163k (22.6% below list) — sets the bar for 1% rule.
- Local home prices are declining (-3.0%/yr); year-one equity from $1k of loan paydown is wiped out by about $6k of value loss. Plan a longer hold.
- Location reads 76/100 on livability (#119 in TX, #3,771 nationally) — a middle-class / working-renter tenant base. Strengths: cost of living A+, housing A+, health & safety A+; Watch: employment D, amenities F, commute F.
- Mcallen ISD (urban): math 34% / reading 45% proficiency, ranked #440 of 826 in TX (top 53%) — families likely to look elsewhere, expect single-tenant / working-renter base with shorter leases.
- Zoned schools: Dr Pablo Perez (math 52% / reading 57%, grade C, #621 of 4,322 statewide, top 15%, 560 students, 50% FRL); Morris Middle (math 59% / reading 61%, grade B, #158 of 1,662 statewide, top 10%, 1,016 students, 52% FRL); Mcallen H S (math 30% / reading 57%, grade F, #704 of 1,632 statewide, top 43%, 2,133 students, 63% FRL) — zoned schools at 55% FRL track the district average.
- Zoned-school proficiency averages 53% at this address vs 40% district-wide (+13 pts) — the actual schools serving this property are materially stronger than the Mcallen ISD average implies; a family-tenant draw the district grade alone would hide.
- Market conditions: Rents rising (+2.6%/yr); 888 active listings in the ZIP; 29 comparable units currently listed for rent nearby; rentals lingering (median 44d on market — plan ~5-8 weeks vacancy on turnover, expect pricing pressure); 69% of comp listings sitting > 30 days — soft ceiling on asking rent; solid renter incomes; 7,378 units permitted in Hidalgo County in 2024 (641 in 5+ unit buildings).
- Hidalgo County population projected at +28% by 2050 — long-run rental-demand tailwind backs the buy-and-hold thesis.
- 2 sale attempts since 4y ago with the ask held roughly flat each time — persistent listings suggest the price (not the market) is what's stuck; bring a comps-based counter.
- Climate carrying-cost: major flood risk; severe wind risk, 99% chance of damaging wind over 30y; extreme-heat days projected 7→23/yr by 2055 (HVAC capex compounding) — expect insurance premiums to compound above CPI over the hold.
- Cap rate 5.3% vs local median 3.7% in McAllen — top-decile yield for the area; either an underpriced asset or a hidden risk that comps aren't pricing in. Stress-test before assuming the spread holds.
Questions for listing agent
- What do current leases actually rent for vs. the listed asking? Can we see a recent rent roll and the last 12 months of T-12 income?
- Is there a deadline driving the sale (1031 exchange, divorce, estate, relocation)? That informs how much negotiation room exists.
- Schools are B-rated — typically a magnet for longer-tenancy family renters. What's the average tenant stay here, and is there a school-zone premium baked into asking?
- The area grade is low — what's the realistic commute time and amenity access for the typical tenant pool here? Any planned neighborhood developments (good or bad) we should know about?
- What's the average days-on-market for RENTAL listings here right now (not sales)? A rising rental-DOM trend means longer vacancies and softer asking-rent achievability than the comps imply.
- What's the recent tenant-quality profile in this submarket — average credit score on applications, eviction rate, late-payment / NSF rate, and stable-employment percentage? A property-management company in the area should have these aggregated.
- How much new for-sale + rental construction is in the pipeline within 1–3 miles? Heavy new supply typically softens prices + rents 12–24 months out; constrained supply supports both.
CashFlowRE · CFR-T460797P5FPVWS
· Data 2 days ago
cashflowre.app · 2026-05-29