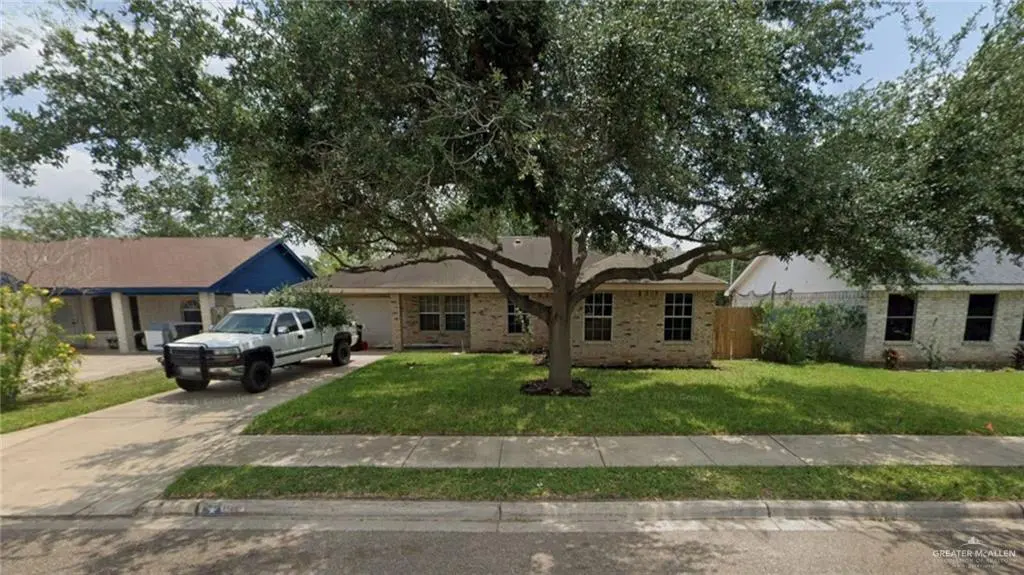
2201 Fullerton Ave · McAllen, TX
Flood risk 6/10 · Moderate
- FEMA flood zone
- X
- Chance of flooding over 30 yrs
- 0.73%
- Est. flood insurance / yr
- $507 – $1,088
Fire risk 2/10 · Minimal
- Est. fire insurance / yr
- $1,222 – $2,270
Heat risk 9/10 · Severe
- Hot days now (above 111°F)
- 7 days/yr
- Hot days in 30 yrs
- 23 days/yr
Wind risk 8/10 · Major
- Chance of severe wind over 30 yrs
- 99.0%
Air-quality risk 2/10 · Minimal
- Unhealthy air days now
- 0 days/yr
- Unhealthy air days in 30 yrs
- 1 days/yr
Risk factors via First Street. Map © Google.
Why this score? — see what drove the F grade
The composite is a weighted blend of 9 inputs, each scored 0–100. Each bar is that input's sub-score; the figure is the points it added to the 100-point composite (weight × sub-score).
- Cash flow +8.7/30.0
- ARV discount +8.2/15.0
- Livability +3.8/5.0
- Schools +3.3/10.0
- Rent growth +3.1/5.0
- 1% rule +2.7/10.0
- Condition / age +2.5/5.0
- DSCR +2.4/10.0
- Appreciation +0.0/10.0
$210,000
🖨 Deal sheet 📄 Offer letter ✓ Due diligence
Listing remarks MLS
Charming 4 bed 2 bath starter home, in an established neighborhood. Driving distance from shopping, schools, short distance from 107. Sofa, love seat, 1 end table, coffee table conveying with the property.
Key facts
- 4,609 sq ft lot
- Garage
- Built 2000
Property features AI
Finance
- HOA & community: No homeowners association
Exterior
- Parking: Attached garage (1 car); 1 covered parking space; Total of 1 parking space
- Utilities: Public water; City sewer; Electric service
- Home design: Single-family property; Front-facing attached garage; Entry facing front
- Construction: Slab foundation; Composition shingle roof; No construction materials specified; Built on a 0.1058-acre lot
- Exterior features: Mature trees; Sidewalks; Storage structure on property; Paved road access
Interior
- Kitchen: Electric water heater; Other appliance(s)
- Flooring: Tile flooring
- Bathrooms: 2 full bathrooms
- Heating & cooling: Central heating (electric); Central air conditioning (electric)
- Interior features: Laminate countertops; Ceiling fan(s); No window coverings
- Laundry & utility: Washer/Dryer connection; Laundry area located in garage
Neighborhood map
What this means for you Summary
Snapshot
- This is a 3-bed/2.0-bath single-family listed at $210k.
Deal economics
- At list price, monthly cash flow is $-178 ($-2k/yr) — negative.
- To cash-flow at today's rent, offer at most $179k (15.0% below list).
- To meet the 1% rule (rent ≥ 1% of price), the offer needs to be $163k (22.6% below list).
- Recommended offer: $163k (22.6% below list) — sets the bar for 1% rule.
- Cap rate 5.3% vs local median 3.7% in McAllen — top-decile yield for the area; either an underpriced asset or a hidden risk that comps aren't pricing in. Stress-test before assuming the spread holds.
Location & tenants
- Location reads 76/100 on livability (#119 in TX, #3,771 nationally) — a middle-class / working-renter tenant base. Strengths: cost of living A+, housing A+, health & safety A+; Watch: employment D, amenities F, commute F.
- Mcallen ISD (urban): math 34% / reading 45% proficiency, ranked #440 of 826 in TX (top 53%) — families likely to look elsewhere, expect single-tenant / working-renter base with shorter leases.
- Zoned schools: Dr Pablo Perez (math 52% / reading 57%, grade C, #621 of 4,322 statewide, top 15%, 560 students, 50% FRL); Morris Middle (math 59% / reading 61%, grade B, #158 of 1,662 statewide, top 10%, 1,016 students, 52% FRL); Mcallen H S (math 30% / reading 57%, grade F, #704 of 1,632 statewide, top 43%, 2,133 students, 63% FRL) — zoned schools at 55% FRL track the district average.
- Zoned-school proficiency averages 53% at this address vs 40% district-wide (+13 pts) — the actual schools serving this property are materially stronger than the Mcallen ISD average implies; a family-tenant draw the district grade alone would hide.
- Market conditions: Rents rising (+2.6%/yr); 888 active listings in the ZIP; 29 comparable units currently listed for rent nearby; rentals lingering (median 44d on market — plan ~5-8 weeks vacancy on turnover, expect pricing pressure); 69% of comp listings sitting > 30 days — soft ceiling on asking rent; solid renter incomes; 7,378 units permitted in Hidalgo County in 2024 (641 in 5+ unit buildings).
Forward outlook
- Local home prices are declining (-3.0%/yr); year-one equity from $1k of loan paydown is wiped out by about $6k of value loss. Plan a longer hold.
- Hidalgo County population projected at +28% by 2050 — long-run rental-demand tailwind backs the buy-and-hold thesis.
Negotiation context
- Only 9 days on market — expect competitive offers; lowballing is unlikely to land.
- 2 sale attempts since 4y ago with the ask held roughly flat each time — persistent listings suggest the price (not the market) is what's stuck; bring a comps-based counter.
Risks & watch-outs
- Climate carrying-cost: major flood risk; severe wind risk, 99% chance of damaging wind over 30y; extreme-heat days projected 7→23/yr by 2055 (HVAC capex compounding) — expect insurance premiums to compound above CPI over the hold.
Questions for the listing agent
- What do current leases actually rent for vs. the listed asking? Can we see a recent rent roll and the last 12 months of T-12 income?
- Is there a deadline driving the sale (1031 exchange, divorce, estate, relocation)? That informs how much negotiation room exists.
- Schools are B-rated — typically a magnet for longer-tenancy family renters. What's the average tenant stay here, and is there a school-zone premium baked into asking?
- The area grade is low — what's the realistic commute time and amenity access for the typical tenant pool here? Any planned neighborhood developments (good or bad) we should know about?
- What's the average days-on-market for RENTAL listings here right now (not sales)? A rising rental-DOM trend means longer vacancies and softer asking-rent achievability than the comps imply.
- What's the recent tenant-quality profile in this submarket — average credit score on applications, eviction rate, late-payment / NSF rate, and stable-employment percentage? A property-management company in the area should have these aggregated.
- How much new for-sale + rental construction is in the pipeline within 1–3 miles? Heavy new supply typically softens prices + rents 12–24 months out; constrained supply supports both.
Investment metrics
- 1% rule
- 0.77% ✗
- Cap rate
- 5.28%
- Cash-on-cash
- -3.63%
- DSCR
- 0.84
- GRM
- 10.8
CMA / ARV
- ARV (on-the-fly)
- $213,312
- Comps found
- 12
Show comp detail 12 sales within ~0.75 mi
| Address | Dist | Beds/Ba | Sqft | Sold | Price | $/sf | Match |
|---|---|---|---|---|---|---|---|
| 2017 Grambling Ave | 0.14mi | 4/2.0 (+1) | 1,207 (-0%) | 3mo | $199,450 | $165 | 85 |
| 2120 Grambling Ave | 0.11mi | 4/2.0 (+1) | 1,212 (0%) | 11mo | $210,000 | $173 | 81 |
| 2100 Fullerton Ave | 0.10mi | 4/2.0 (+1) | 1,212 (0%) | 12mo | $180,000 | $149 | 80 |
| 2013 Baylor Ave | 0.26mi | 3/2.0 | 1,282 (+6%) | 13mo | $225,000 | $176 | 67 |
| 2005 Fairmont Ave | 0.16mi | 3/2.0 | 1,042 (-14%) | 4mo | $187,000 | $179 | 66 |
| 2108 Zenaida Ave | 0.30mi | 3/2.0 | 1,282 (+6%) | 15mo | $215,000 | $168 | 64 |
| 2121 Fullerton Ave | 0.05mi | 3/2.0 | 1,047 (-14%) | 16mo | $178,000 | $170 | 62 |
| 2712 Indian Hill Ave | 0.54mi | 3/2.0 | 1,200 (-1%) | 14mo | $219,000 | $183 | 62 |
| 2720 Indian Hill Ave | 0.56mi | 3/2.0 | 1,215 (+0%) | 15mo | $219,000 | $180 | 62 |
| 2812 Indian Hill Ave | 0.59mi | 3/2.0 | 1,321 (+9%) | 4mo | $259,000 | $196 | 54 |
| 8802 N 29th Ln | 0.70mi | 3/2.0 | 1,144 (-6%) | 7mo | $179,000 | $156 | 52 |
| 2010 Verdin Ave | 0.58mi | 2/2.0 (-1) | 1,063 (-12%) | 12mo | $190,000 | $179 | 37 |
Match score weights: distance 35% · size 25% · config 20% · recency 20%. Top-matched comps best support the ARV.
Projected returns pro-forma
-3.0% appreciation · 2.57% rent growth · sell at horizon
- IRR
- -22.9%
- Equity multiple
- 0.22×
- Total profit
- $-46,036
- Equity at exit
- $31,312
- IRR
- -18.4%
- Equity multiple
- 0.02×
- Total profit
- $-57,408
- Equity at exit
- $18,157
Cash invested: $58,800 (down + closing). Projections, not guarantees.
Landlord ↔ Tenant lean methodology
- Overall (STATE)
- 87 Strongly Landlord-Friendly
- State Texas
- 87 Strongly Landlord-Friendly · R+5
- County
- — inherits STATE
- City
- — inherits STATE
ZIP-level market 78504
- Home prices YoY
- -29.4%
- Rents YoY
- 2.6%
- Active inventory
- 888
- Price-to-rent
- 10.8×
Monthly cashflow live
- Estimated rent
- $1,626 high interval (Pro) →
- Mortgage (P&I)
- −$1,101
- Tax from tax record
- −$274 /mo · $3,289/yr
- Insurance
- −$88
- HOA
- −$0
- Vacancy / Maint / Mgmt
- −$342
- Net cashflow
- $-178
Break-even live
UW: 25.0% down · 7.5% · 30yr · 1.5% tax · 5.0% vac · 8.0% maint · 8.0% mgmt
Financing live
Cash to close
- Down payment
- $52,500
- Closing costs
- $6,300
- Reserves months
- —
- Total cash needed
- —
Loan-product check · same deal, 3 products live
Conventional
25% down · 7.5% · 30yr
- Down + closing
- —
- Monthly P&I
- —
- Monthly cashflow
- —
- DSCR
- —
- Eligible?
- —
Personal DTI + credit; lowest rate.
DSCR
20% down · 8.5% · 30yr
- Down + closing
- —
- Monthly P&I
- —
- Monthly cashflow
- —
- DSCR
- —
- Eligible?
- —
No personal income docs; deal must DSCR.
Hard money
10% down · 12.0% · 12mo
- Down + closing
- —
- Monthly P&I
- —
- Monthly cashflow
- —
- DSCR
- —
- Eligible?
- —
Short-term bridge; refi at stabilization.
Rent comps 29 comps
| Address | Beds | Baths | Sqft | Rent | $/sqft | DOM | Units | Dist |
|---|---|---|---|---|---|---|---|---|
| 5813 Northwestern Ave Unit 2 McAllen, TX | 3.0 | 2.0 | 1000 | $1,400 | $1.40 | 43d | 1 | 0.64mi |
| 2629 Warbler Ave McAllen, TX | 3.0 | 2.5 | 1420 | $2,100 | $1.48 | 43d | 1 | 0.72mi |
| 8914 N 29th Ln McAllen, TX | 3.0 | 2.0 | 1165 | $1,325 | $1.14 | 43d | 1 | 0.73mi |
| 2900 Kilgore Ave McAllen, TX | 3.0 | 2.0 | 1144 | $1,400 | $1.22 | 23d | 1 | 0.74mi |
| 8406 N 33rd Ln McAllen, TX | 3.0 | 2.0 | 1448 | $2,000 | $1.38 | 14d | 1 | 0.88mi |
| 7008 N 23rd St Unit 117 McAllen, TX | 2.0 | 2.0 | 1327 | $1,275 | $0.96 | 44d | 1 | 0.89mi |
| 8330 N 34th Ln McAllen, TX | 2.0 | 3.0 | 1458 | $2,250 | $1.54 | 23d | 1 | 0.94mi |
| 3317 Duke Ave Unit 1 McAllen, TX | 2.0 | 2.0 | 980 | $1,200 | $1.22 | 43d | 1 | 0.94mi |
| 3401 Duke Ave Unit 3401 McAllen, TX | 2.0 | 2.0 | 980 | $1,250 | $1.28 | 43d | 1 | 0.96mi |
| 3401 Duke Ave Unit 2 McAllen, TX | 2.0 | 2.0 | 980 | $1,200 | $1.22 | 43d | 1 | 0.97mi |
| 3412 Duke Ave Unit 2 McAllen, TX | 2.0 | 2.0 | 975 | $1,800 | $1.85 | 14d | 1 | 1.00mi |
| 3416 Duke Ave Unit 1 McAllen, TX | 2.0 | 2.0 | 980 | $1,250 | $1.28 | 43d | 1 | 1.01mi |
| 3500 Duke Ave Unit 4 McAllen, TX | 3.0 | 2.0 | 1180 | $1,600 | $1.36 | 43d | 1 | 1.03mi |
| 6720 N 23rd St Unit 3 McAllen, TX | 2.0 | 2.0 | 1000 | $980 | $0.98 | 43d | 1 | 1.03mi |
| 3509 Duke Ave Unit 3509 McAllen, TX | 2.0 | 2.0 | 980 | $1,200 | $1.22 | 43d | 1 | 1.06mi |
| 4923 N 35th Ln McAllen, TX | 2.0–4.0 | 2.0–2.5 | 1373 | $2,062 | $1.50 | 14d | 11 | 1.11mi |
| 1409 Xavier Ave McAllen, TX | 2.0 | 2.0 | 1178 | $1,750 | $1.49 | 43d | 1 | 1.28mi |
| 10201 N 14th St McAllen, TX | 2.0 | 2.0 | 1249 | $2,300 | $1.84 | 43d | 1 | 1.30mi |
| 10221 N 15th St McAllen, TX | 3.0 | 2.0 | 1418 | $2,200 | $1.55 | 43d | 1 | 1.33mi |
| 11502 N 24th Ln Apt 1 McAllen, TX | 2.0 | 2.0 | 1050 | $1,195 | $1.14 | 43d | 1 | 1.34mi |
| 11502 N 24th Ln McAllen, TX | 2.0 | 2.0 | 1025 | $1,200 | $1.17 | 43d | 1 | 1.34mi |
| 6313 N 20th St McAllen, TX | 3.0 | 2.0 | 1326 | $1,550 | $1.17 | 14d | 1 | 1.34mi |
| 11403 N 24th Ln Unit 1 McAllen, TX | 2.0 | 2.0 | 917 | $1,200 | $1.31 | 43d | 1 | 1.34mi |
| 11507 N 24th Ln Unit 1 McAllen, TX | 2.0 | 2.0 | 918 | $1,195 | $1.30 | 43d | 1 | 1.34mi |
| 11507 N 24th Ln Unit 3 McAllen, TX | 3.0 | 2.0 | 1080 | $1,300 | $1.20 | 43d | 1 | 1.34mi |
| 11403 N 24th Ln Unit 4 McAllen, TX | 3.0 | 2.0 | 1083 | $1,300 | $1.20 | 43d | 1 | 1.34mi |
| 701 Sandpiper Ave Unit 1 McAllen, TX | 3.0 | 2.0 | 1162 | $1,175 | $1.01 | 23d | 1 | 1.39mi |
| 10333 N 15th St McAllen, TX | 3.0 | 2.0 | 1414 | $2,100 | $1.49 | 14d | 1 | 1.41mi |
| 6220 N 11th St McAllen, TX | 1.0–2.0 | 1.0 | 20493 | $875 | $0.04 | 21d | 3 | 1.50mi |
Listing history 7 events
-
2026-06-18days on market $210,000 Active 9 DOM
-
2026-06-17days on market $210,000 Active 8 DOM
-
2026-06-16days on market $210,000 Active 7 DOM
-
2026-06-15days on market $210,000 Active 6 DOM
-
2026-06-14days on market $210,000 Active 4 DOM
-
2026-06-10remarks 249-char remark
-
2026-06-10$210,000 Active 1 DOM
ⓘ Source: listings_history table (triggers on properties + properties_extension) + one-shot
backfill from property_details.listing_events for pre-trigger history.
Tax reassessment forecast TX · Resets to sale price
- Current annual tax
- $3,289 · $274/mo
- Projected year-2 tax
- $3,843 · $320/mo
- Expected delta
- +$554/yr (+$46/mo · 16.8%)
ⓘ Screening estimate from a state-policy table — verify with the county assessor before closing.
Climate risk First Street
- Flood 6/10 Major FEMA zone X · 73% chance over 30 yrs
- Wildfire 2/10 Low
- Heat 9/10 Extreme 7 d/yr ≥111°F today · 23 d/yr by 30 yrs out
- Wind 8/10 Severe 99% chance of damaging wind over 30 yrs
- Air quality 2/10 Low 0 unhealthy d/yr today · 1 by 30 yrs out
Nearby sold comps map
Loading sold comps map…
Walkable amenities ~0.75 mi
Loading nearby amenities…
Taxation est. · year 1
- Rental income
- $19,517
- − Mortgage interest
- −$11,763
- − Property taxes
- −$3,289
- − Insurance
- −$1,050
- − Repairs & maintenance
- −$1,561
- − Management
- −$1,561
- − Depreciation
- −$6,109
- Taxable loss
- −$5,818
- Est. tax savings @ 24.0%
- +$1,396
- After-tax cash flow
- $-740/yr
For passive investors: Depreciation is non-cash, so a rental often shows a tax loss while cash-flowing — sheltering income. Rental losses are passive: they offset passive income freely, and up to $25,000/yr can offset ordinary (W-2) income if you actively participate and your MAGI is under $100k (phasing out to $0 by $150k); unused losses carry forward. On sale, claimed depreciation is recaptured at up to 25%, and gains may owe capital-gains tax (a 1031 exchange can defer both). Figures are a year-1 estimate at your 24.0% rate — not tax advice; consult a CPA.
Schools (NCES district)
- District
- Mcallen ISD
- NCES district ID
- 4829670
- Math proficiency
- 34% ▼ -22.00%
- Reading proficiency
- 45% ▼ -5.00%
- Median HH income
- $40,805
- Composite
- 33.16/100
- National rank
- #5551
- State rank
- #440 of 826 in TX
Livability — McAllen
- Score
- 76/100
- State rank
- #119
- US rank
- #3771
Category grades
Schools grade is shown separately in the Schools card above.
Census & demographics
- Census place
- McAllen, TX
- County
- Hidalgo County · 623,128 people
- City population
- 144,650
- Metro
- McAllen-Edinburg-Mission, TX
- Population (ZIP)
- 63,094
- Household income
- $81,905
- Rent vs Own
- Severe rent burden
- 1468.0
Population outlook (Hidalgo County) Hauer SSP2
- Today (2025)
- 955,232 people
- By 2030
- 1,009,774 · +5.7%
- By 2040
- 1,120,332 · +17.3%
- By 2050
- 1,225,036 · +28.2%
- By 2075
- 1,439,189 · +50.7%
- By 2100
- 1,533,429 · +60.5%
Race, ethnicity, and origin ACS 2023
- Neighborhood character
- Predominantly Hispanic (82%)
- Race & ethnicity
- Hispanic / Latino 82% Two or more races 39% White 11% Asian 5%
- Hispanic origin (detail)
- Mexican 75%
- Common ancestry
- Lithuanian 1% Italian 1%
- Foreign-born
- 24% · Canada, South Korea, Vietnam
- Languages at home
- 34% English-only · Spanish 62% Other Asian/Pacific 1% Tagalog/Filipino 1%
Political lean MEDSL · Hidalgo
- 2024 margin
- Toss-up / Even · D 48.1% · R 51.0%
- 2008→2024 swing
- -41.6pp toward R · 2008: 38.7pp · 2024: -2.9pp
- All cycles
- 2024: R+2.9 2020: D+17.1 2016: D+40.5 2012: D+41.8 2008: D+38.7
Not yet ingested
- Civics
- —
Market trends
- HPI YoY
- ▼ -80.87%
- Current HPI
- 194.1764
- Rent YoY
- ▲ 2.57%
- Metro
- McAllen-Edinburg-Mission, TX
- State GDP YoY
- ▲ 3.95%
- F500 in state
- 110
Industry mix (Fortune 500 HQ in TX)
| Industry | F500 HQs | Revenue |
|---|---|---|
| Energy | 16 | $1,198B |
|
||
| Technology | 5 | $198B |
|
||
| Engineering / Construction | 4 | $72B |
|
||
| Energy Services | 3 | $60B |
|
||
| Utilities | 3 | $41B |
|
||
| Healthcare | 2 | $330B |
|
||
Price history
+31.2% since first listed5 events — show timeline
- 2026-06-08 Listed $210,000 MCALLENMLS
- 2022-04-19 Sold (MLS) — MCALLENMLS
- 2022-03-16 Pending — MCALLENMLS
- 2022-02-19 Contingent — MCALLENMLS
- 2022-02-14 Listed $160,000 MCALLENMLS
Property tax history
+4.7%/yrLatest (2025): $3,289 · +16.7% YoY. Source: county tax records.
Cash-flow waterfall
monthlySold comps — $/sqft
last 12 mo · ≤1 miLoading sold comps…