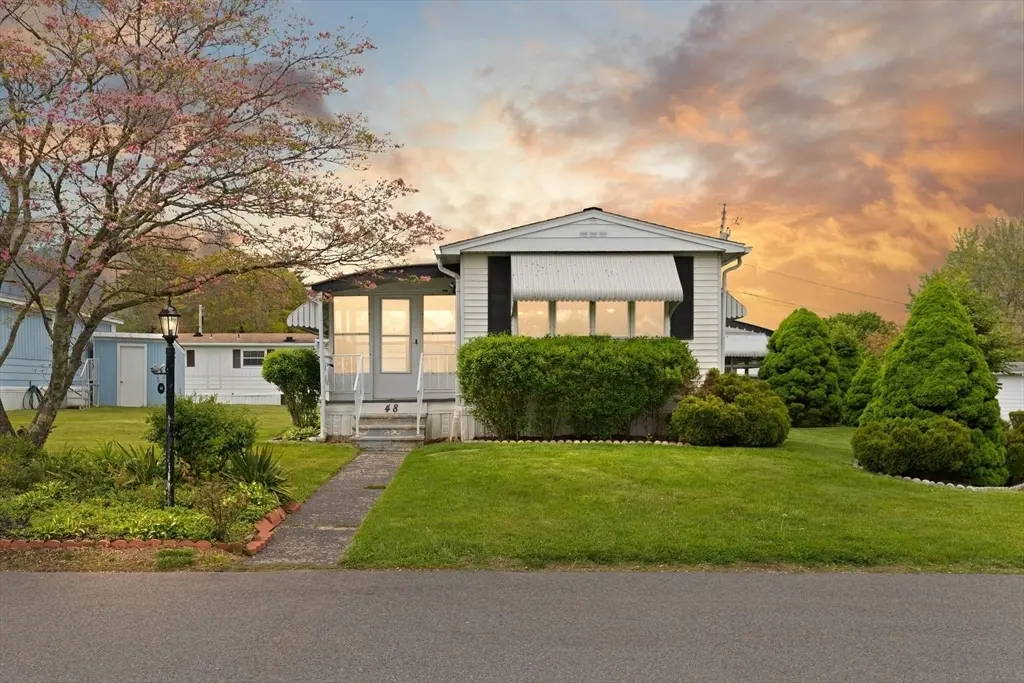
48 Easy St
Taunton, MA 02767
$200,000D+
2 bd · 1.0 ba ·
980 sqft ·
Built 1977
· Manufactured
· Active
· 33 DOM
Cashflow @ list (25.0% down · 7.5%)
Estimated rent
$2,448/mo
Mortgage (P&I)
−$1,049
Tax + insurance
−$333
HOA
−$631
Vac / Maint / Mgmt
−$514
Net cashflow
$-79/mo
Annual
$-950/yr
Cap rate
5.82%
Cash-on-cash
-1.70%
DSCR
0.92
1% rule
1.22%
Cash to close
$56,000
Investor read
- This is a 2-bed/1.0-bath manufactured listed at $200k.
- At list price, monthly cash flow is $-79 ($-950/yr) — negative.
- To cash-flow at today's rent, offer at most $189k (5.7% below list).
- Meets the 1% rule at list price ($2k rent vs $200k).
- It's been on market 33 days — a 3% lower offer ($194k) is reasonable based on typical stale-listing flexibility.
- Recommended offer: $189k (5.7% below list) — sets the bar for cash-flow.
- Local home prices are declining (-3.0%/yr); year-one equity from $1k of loan paydown is wiped out by about $6k of value loss. Plan a longer hold.
- Location reads 75/100 on livability (#78 in MA, #4,184 nationally) — a middle-class / working-renter tenant base. Strengths: commute A+, housing A+, health & safety A+; Watch: schools C-, crime C-, amenities F.
- Bridgewater-Raynham (suburban): math 42% / reading 51% proficiency, ranked #139 of 302 in MA (top 46%) — families likely to look elsewhere, expect single-tenant / working-renter base with shorter leases; only 15% free/reduced lunch — higher-income household profile.
- Watch-outs: HOA is 26% of rent.
- Market conditions: 40 active listings in the ZIP; 2 comparable units currently listed for rent nearby; 760 units permitted in Bristol County in 2024 (142 in 5+ unit buildings).
- Bristol County population projected to shrink 3% by 2050 — rents likely to lag national; underwrite the cash flow, not the appreciation.
- 3 sale attempts since 14y ago with the ask held roughly flat each time — persistent listings suggest the price (not the market) is what's stuck; bring a comps-based counter.
- Current owner paid $133k; list at $200k implies a 50% gain — meaningful room to come down on a strong offer.
- Climate carrying-cost: major wind risk, 74% chance of damaging wind over 30y; extreme-heat days projected 7→15/yr by 2055 (HVAC capex compounding) — expect insurance premiums to compound above CPI over the hold.
- Cap rate 5.8% vs local median 3.0% in Taunton — top-decile yield for the area; either an underpriced asset or a hidden risk that comps aren't pricing in. Stress-test before assuming the spread holds.
Questions for listing agent
- What do current leases actually rent for vs. the listed asking? Can we see a recent rent roll and the last 12 months of T-12 income?
- It's been on market 33 days. Have you received any prior offers? Is the seller open to a 6% concession, seller financing, or rate buy-down credit?
- Built in 1977 — when were the roof, HVAC, electrical panel, plumbing, and water heater last replaced?
- What does the HOA fee cover, when was the last increase, and are there any pending special assessments or reserve-fund shortfalls?
- Is there a deadline driving the sale (1031 exchange, divorce, estate, relocation)? That informs how much negotiation room exists.
- The area grade is low — what's the realistic commute time and amenity access for the typical tenant pool here? Any planned neighborhood developments (good or bad) we should know about?
- What's the average days-on-market for RENTAL listings here right now (not sales)? A rising rental-DOM trend means longer vacancies and softer asking-rent achievability than the comps imply.
- What's the recent tenant-quality profile in this submarket — average credit score on applications, eviction rate, late-payment / NSF rate, and stable-employment percentage? A property-management company in the area should have these aggregated.
CashFlowRE · CFR-T4C9JQ0QZ3H9VW
· Data 16 h ago
cashflowre.app · 2026-05-29