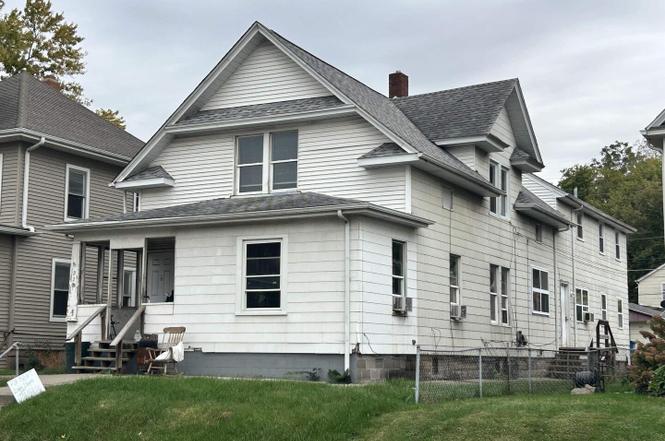
512 17th Ave #4
East Moline, IL 61244
$149,900B-
8 bd · 4.0 ba ·
— sqft ·
Built 1925
· MultiFamily
· Pending
Cashflow @ list (25.0% down · 7.5%)
Estimated rent
$4,292/mo
Mortgage (P&I)
−$786
Tax + insurance
−$250
HOA
−$0
Vac / Maint / Mgmt
−$901
Net cashflow
$2,355/mo
Annual
$28,257/yr
Cap rate
25.14%
Cash-on-cash
67.32%
DSCR
4.00
1% rule
2.86%
Cash to close
$41,972
Investor read
- This is a 3×2bd/1.0ba + 1×3bd/1.0ba units multifamily listed at $150k.
- At list price, monthly cash flow is $2k ($28k/yr) — positive. Per door: $589/mo.
- The deal already cash-flows at list — no discount required.
- Meets the 1% rule at list price ($4k rent vs $150k).
- Only 0 days on market — expect competitive offers; lowballing is unlikely to land.
- Local home prices are declining (-3.0%/yr); year-one equity from $1k of loan paydown is wiped out by about $4k of value loss. Plan a longer hold.
- Location reads 62/100 on livability (#870 in IL) — a middle-class / working-renter tenant base. Strengths: cost of living A+, housing A+; Watch: crime C-, employment C-, schools F.
- United Twp Hsd 30 (suburban): math 12% / reading 15% proficiency, ranked #536 of 620 in IL (top 86%) — low school quality limits family demand, transient renter base, plan for 1-2y turnover.
- Watch-outs: built in 1925 — expect roof / HVAC / electrical / plumbing capex.
- Market conditions: 124 active listings in the ZIP; 116 units permitted in Rock Island County in 2024 (50 in 5+ unit buildings).
- Rock Island County population projected at -12% by 2050 — secular population decline; favor cash flow + early exit over multi-decade hold.
- 2 sale attempts with the ask held roughly flat each time — persistent listings suggest the price (not the market) is what's stuck; bring a comps-based counter.
- At projected returns (-3.0% appreciation + 3.0% rent growth), your $42k cash investment doubles in ~2 years — after that, you're playing with house money.
- Cap rate 25.1% vs local median 3.5% in East Moline — top-decile yield for the area; either an underpriced asset or a hidden risk that comps aren't pricing in. Stress-test before assuming the spread holds.
- At $4,292/mo this rent would consume 81% of the median local household income ($64k/yr) (locally 746% of renters already pay >50% of income on rent) — very limited rent-growth headroom before tenants either downsize or default.
Questions for listing agent
- Can we see the unit-by-unit rent roll, current vacancy, and any below-market leases? What's the average tenancy length?
- What capital expenditures (roof, boiler, parking lot, exteriors) have been made in the last 5 years, and what's planned in the next 2?
- Built in 1925 — when were the roof, HVAC, electrical panel, plumbing, and water heater last replaced?
- Is there a deadline driving the sale (1031 exchange, divorce, estate, relocation)? That informs how much negotiation room exists.
- Schools are F-rated, which usually means shorter tenancies and higher turnover. Who's the typical renter profile here, and what's been the actual vacancy rate?
- What's the average days-on-market for RENTAL listings here right now (not sales)? A rising rental-DOM trend means longer vacancies and softer asking-rent achievability than the comps imply.
- What's the recent tenant-quality profile in this submarket — average credit score on applications, eviction rate, late-payment / NSF rate, and stable-employment percentage? A property-management company in the area should have these aggregated.
- How much new apartment / multifamily construction is in the pipeline within 1–3 miles? Heavy new supply (>2% of stock underway) typically softens rents 12–24 months out; light construction supports rent growth.
CashFlowRE · CFR-T7BATTEPP4KDP8
· Data 3 weeks ago
cashflowre.app · 2026-05-29